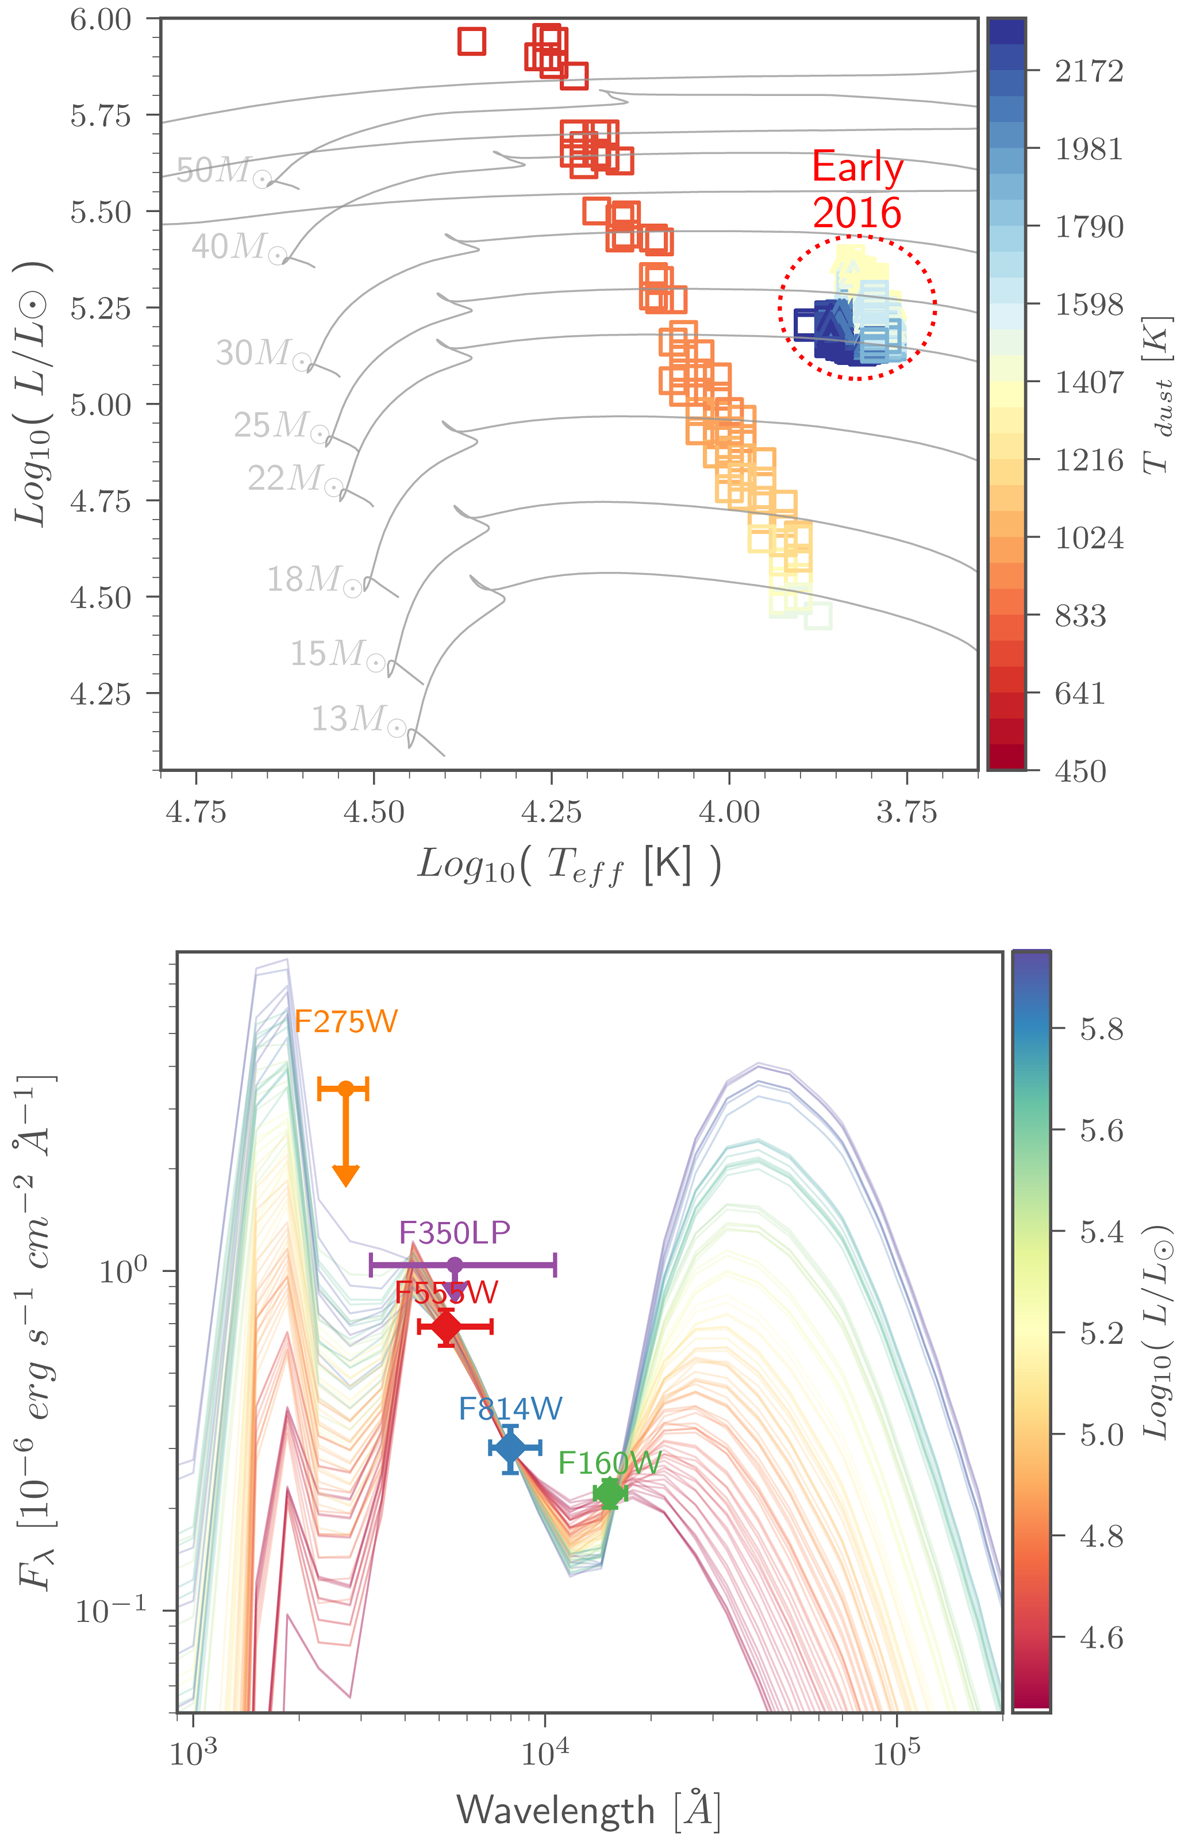
Fig. 4.

Download original image
Upper panel: HRD showing model luminosities and effective temperatures. The colour of the markers represents the necessary dust temperature required to match the remnant colours. For reference, we overplot single-star evolutionary tracks from the BPASS models (Eldridge et al. 2017; Stanway & Eldridge 2018). We highlight the progenitor appearance in early 2016 from Brennan et al. (2022b). Lower panel: matching spectra from DUSTY. Markers with error bars represent the extinction-corrected flux from the 2021 data given in Table 1. The colour of each spectral energy distribution represents the luminosity of the scaled model. We treat the F275W measurement from March 2021 and the F350LP data from December 2021 as upper limits.
Current usage metrics show cumulative count of Article Views (full-text article views including HTML views, PDF and ePub downloads, according to the available data) and Abstracts Views on Vision4Press platform.
Data correspond to usage on the plateform after 2015. The current usage metrics is available 48-96 hours after online publication and is updated daily on week days.
Initial download of the metrics may take a while.


