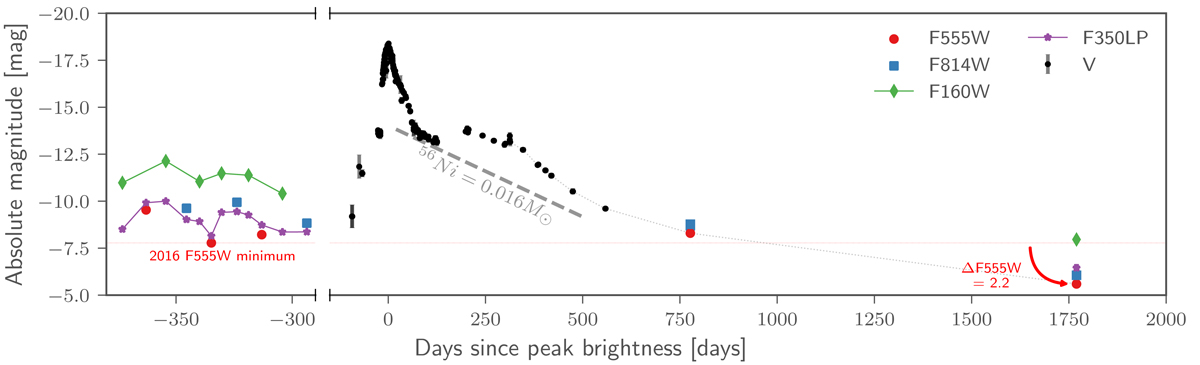
Fig. 2.
Download original image
Light curve of SN 2016jbu including HST observations from Table 1 and Brennan et al. (2022b), and V-band (black markers) observations from Brennan et al. (2022a). We include the expected luminosity from 0.016 M⊙ of 56Ni in the V-band (Hamuy 2003; Brennan et al. 2022b) as the sloped dashed line. We connect points in the late-time light curve to visualise the non-linear decline.
Current usage metrics show cumulative count of Article Views (full-text article views including HTML views, PDF and ePub downloads, according to the available data) and Abstracts Views on Vision4Press platform.
Data correspond to usage on the plateform after 2015. The current usage metrics is available 48-96 hours after online publication and is updated daily on week days.
Initial download of the metrics may take a while.