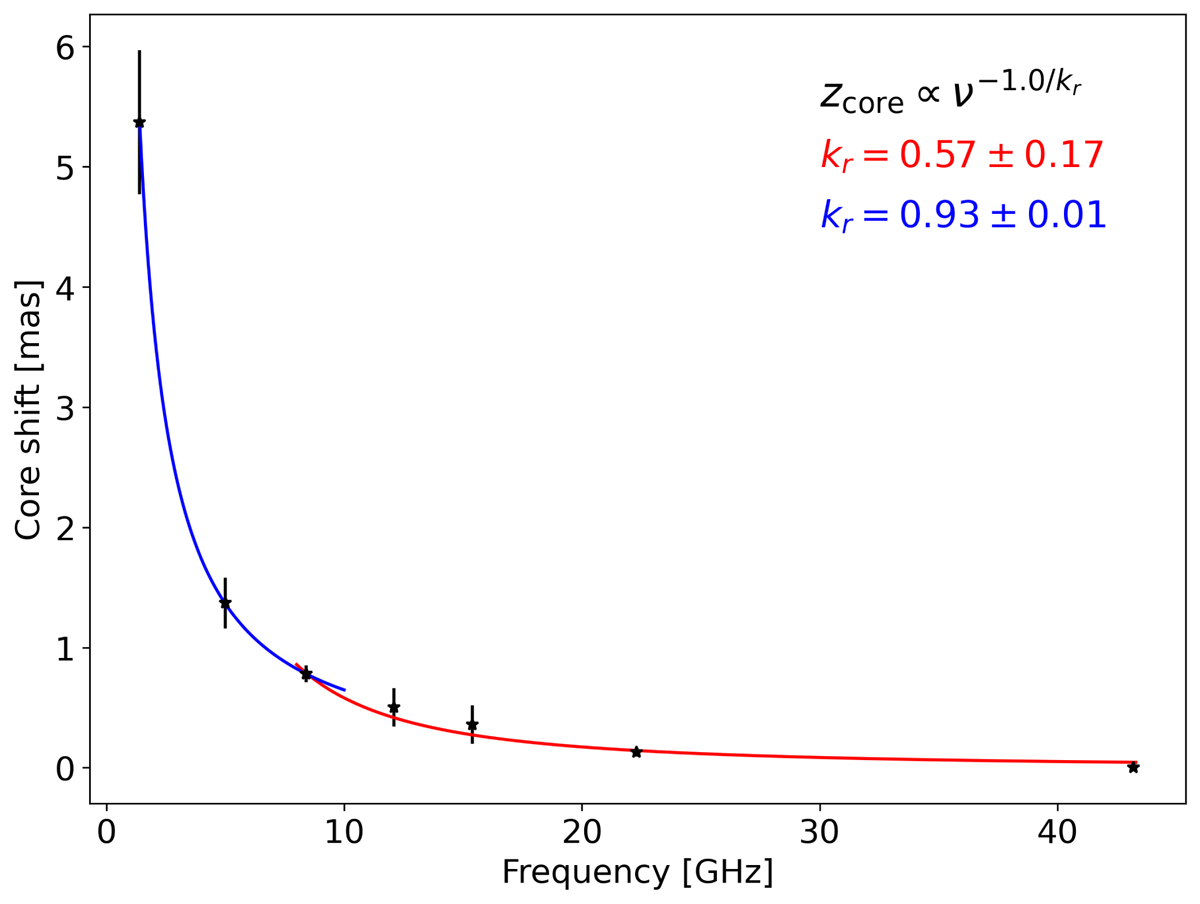
Fig. 7.
Download original image
Core positions as a function of frequency, assumed from B21. The data are fitted with two different power laws: one for the parabolic region (red curve) and one for the conical region (blue curve). In the former case, the best fit index is kr = 0.57 ± 0.17, while in the latter, it is kr = 0.93 ± 0.01. An index close to 1 is expected when assuming equipartition between the particles and magnetic field energy densities in the jet.
Current usage metrics show cumulative count of Article Views (full-text article views including HTML views, PDF and ePub downloads, according to the available data) and Abstracts Views on Vision4Press platform.
Data correspond to usage on the plateform after 2015. The current usage metrics is available 48-96 hours after online publication and is updated daily on week days.
Initial download of the metrics may take a while.