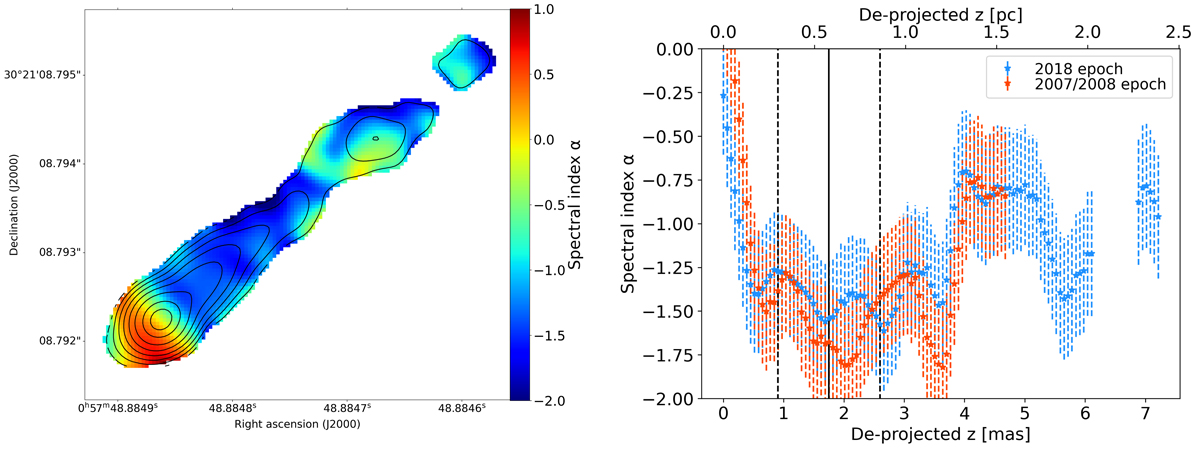
Fig. 2.
Download original image
Spectral index analysis between the frequencies 22 GHz and 43 GHz. Left panel: spectral index map, the contours outline the 43 GHz continuum emission. Right panel: average spectral index along one-pixel slices as a function of distance from the core for two different epochs. The two profiles are in agreement within the errors. The black vertical lines demarcate the jet shape transition distance with its uncertainty. Within the collimation region, the spectral index rapidly decreases down to values of α ∼ −1.5, while it rises to typical values of α ∼ −0.75 beyond the shape transition distance.
Current usage metrics show cumulative count of Article Views (full-text article views including HTML views, PDF and ePub downloads, according to the available data) and Abstracts Views on Vision4Press platform.
Data correspond to usage on the plateform after 2015. The current usage metrics is available 48-96 hours after online publication and is updated daily on week days.
Initial download of the metrics may take a while.