Fig. 4
Download original image
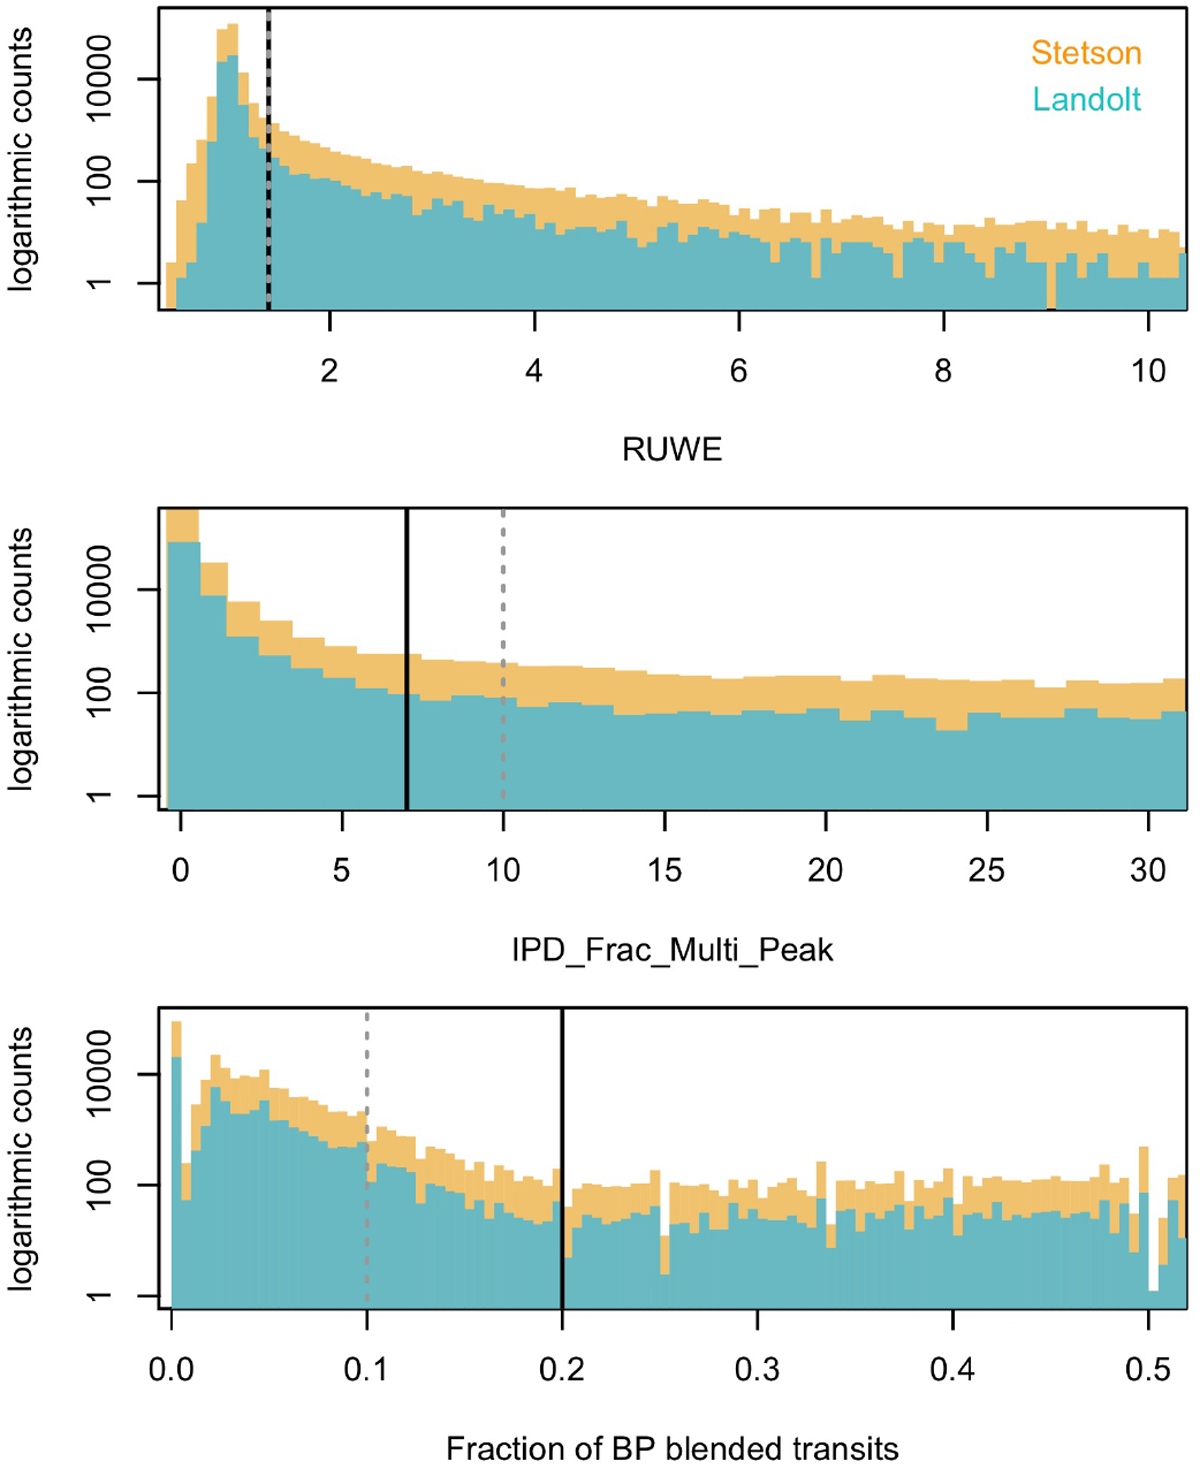
Example of quality thresholds: each panel shows the logarithmic histogram of some of the explored Gaia EDR3 parameters, for the Landolt (cyan) and Stetson (orange) collections. The recommended thresholds by Lindegren et al. (2021b), Fabricius et al. (2021), and Riello et al. (2021) are indicated by grey dotted vertical lines, while our final adopted ones are indicated by black solid lines.
Current usage metrics show cumulative count of Article Views (full-text article views including HTML views, PDF and ePub downloads, according to the available data) and Abstracts Views on Vision4Press platform.
Data correspond to usage on the plateform after 2015. The current usage metrics is available 48-96 hours after online publication and is updated daily on week days.
Initial download of the metrics may take a while.