Fig. 11
Download original image
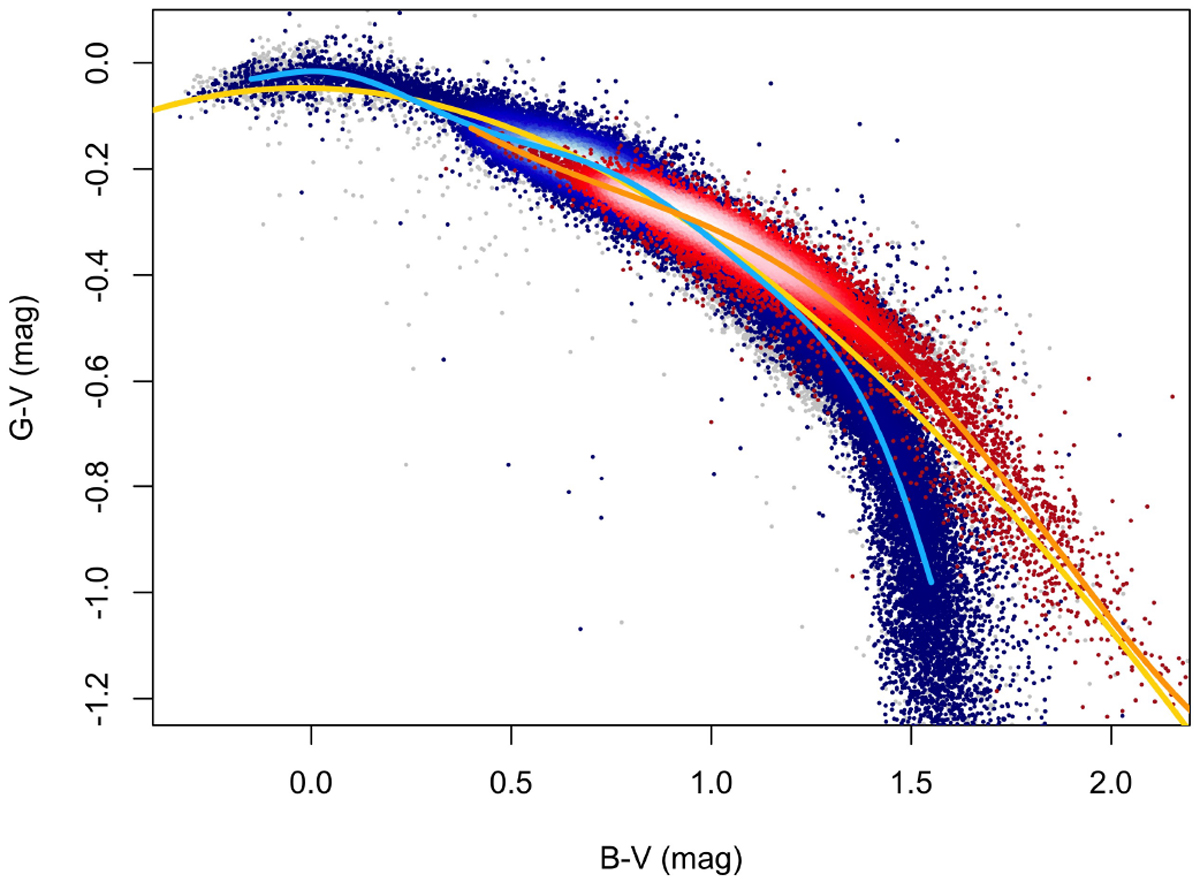
Example of transformation from V, B–V to the Gaia G magnitude, illustrating the advantage of performing separate polynomial fits for dwarfs and giants. The whole clean sample is plotted in the background as grey dots, dwarfs are plotted in blue, and giants in red. The polynomials fitted on the two samples separately are plotted as a light blue and an orange line, respectively. The polynomial fit by Riello et al. (2021) is plotted in yellow: it reproduces the dwarfs at blue colors, the giants at red colors, and passes between the two at intermediate colors.
Current usage metrics show cumulative count of Article Views (full-text article views including HTML views, PDF and ePub downloads, according to the available data) and Abstracts Views on Vision4Press platform.
Data correspond to usage on the plateform after 2015. The current usage metrics is available 48-96 hours after online publication and is updated daily on week days.
Initial download of the metrics may take a while.