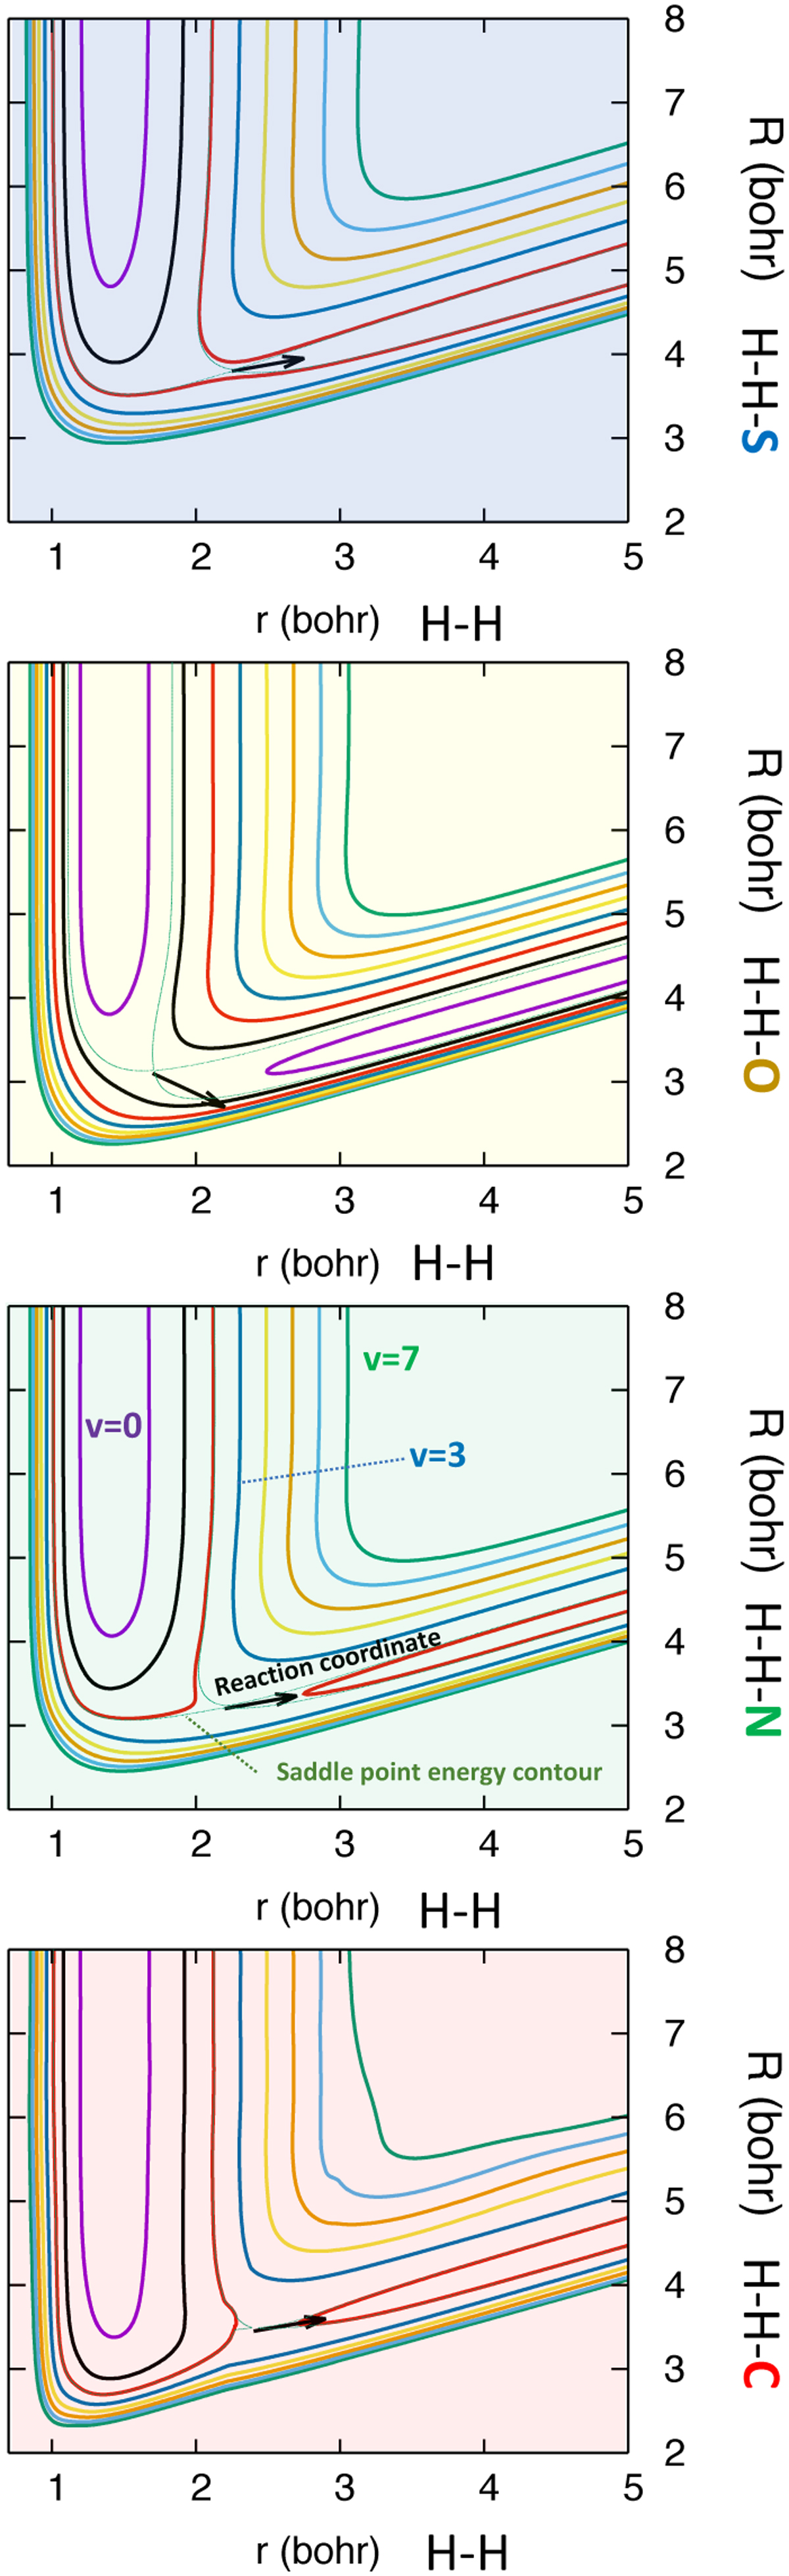
Fig. 3
Download original image
Contour plot of the potential energy surfaces describing reactions X + H2 → XH + Η (with X = C, N, O, and S) as a function of r, the H2 internuclear distance, and R, the distance between the Ν and H2 center-of-mass in a collinear H–H–X configuration. Contours correspond to the vibrational energies of H2 from ν = 0 to 7. The thin green line shows the saddle point energy contour. The thick black arrow is a graphical representation of the reaction coordinate at the top of the barrier.
Current usage metrics show cumulative count of Article Views (full-text article views including HTML views, PDF and ePub downloads, according to the available data) and Abstracts Views on Vision4Press platform.
Data correspond to usage on the plateform after 2015. The current usage metrics is available 48-96 hours after online publication and is updated daily on week days.
Initial download of the metrics may take a while.