Fig. 2
Download original image
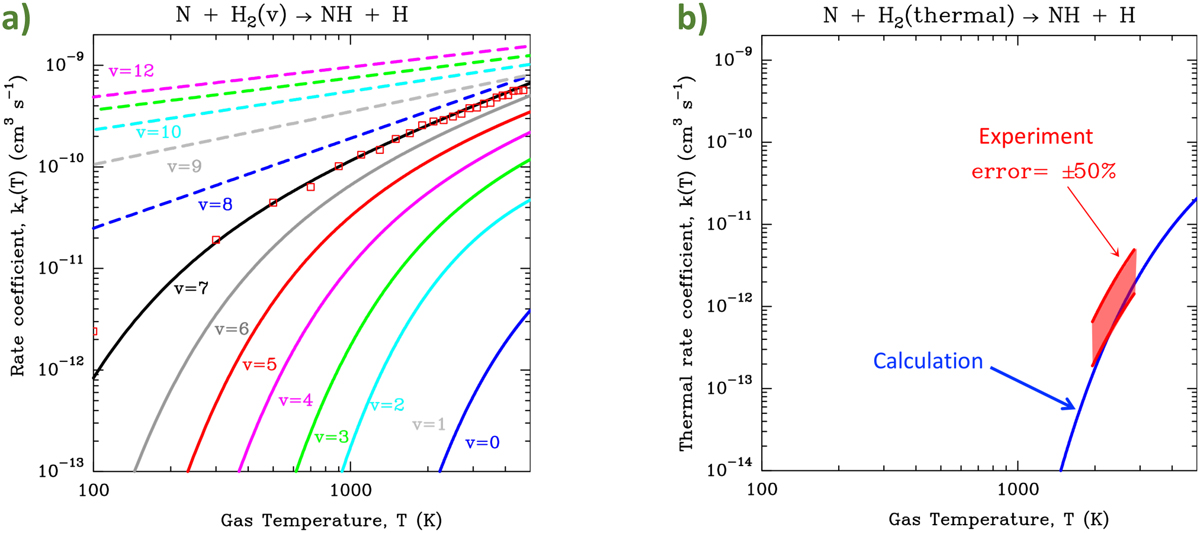
Calculated rate coefficients of reaction ![]() . Left panel: H2 vibrational-state-specific rates from wave packet calculations (continuous curves) and QCT calculations (dashed curves). Red squares show how QCT calculations reproduce the quantum calculations for v = 7. Right panel: thermal rate coefficient (blue curve) calculated from thermal averages of the state-specific rate coefficients. The red shaded area represents the experimental values determined by Davidson & Hanson (1990) allowing for an experimental error of ±50%.
. Left panel: H2 vibrational-state-specific rates from wave packet calculations (continuous curves) and QCT calculations (dashed curves). Red squares show how QCT calculations reproduce the quantum calculations for v = 7. Right panel: thermal rate coefficient (blue curve) calculated from thermal averages of the state-specific rate coefficients. The red shaded area represents the experimental values determined by Davidson & Hanson (1990) allowing for an experimental error of ±50%.
Current usage metrics show cumulative count of Article Views (full-text article views including HTML views, PDF and ePub downloads, according to the available data) and Abstracts Views on Vision4Press platform.
Data correspond to usage on the plateform after 2015. The current usage metrics is available 48-96 hours after online publication and is updated daily on week days.
Initial download of the metrics may take a while.