Fig. A.2
Download original image
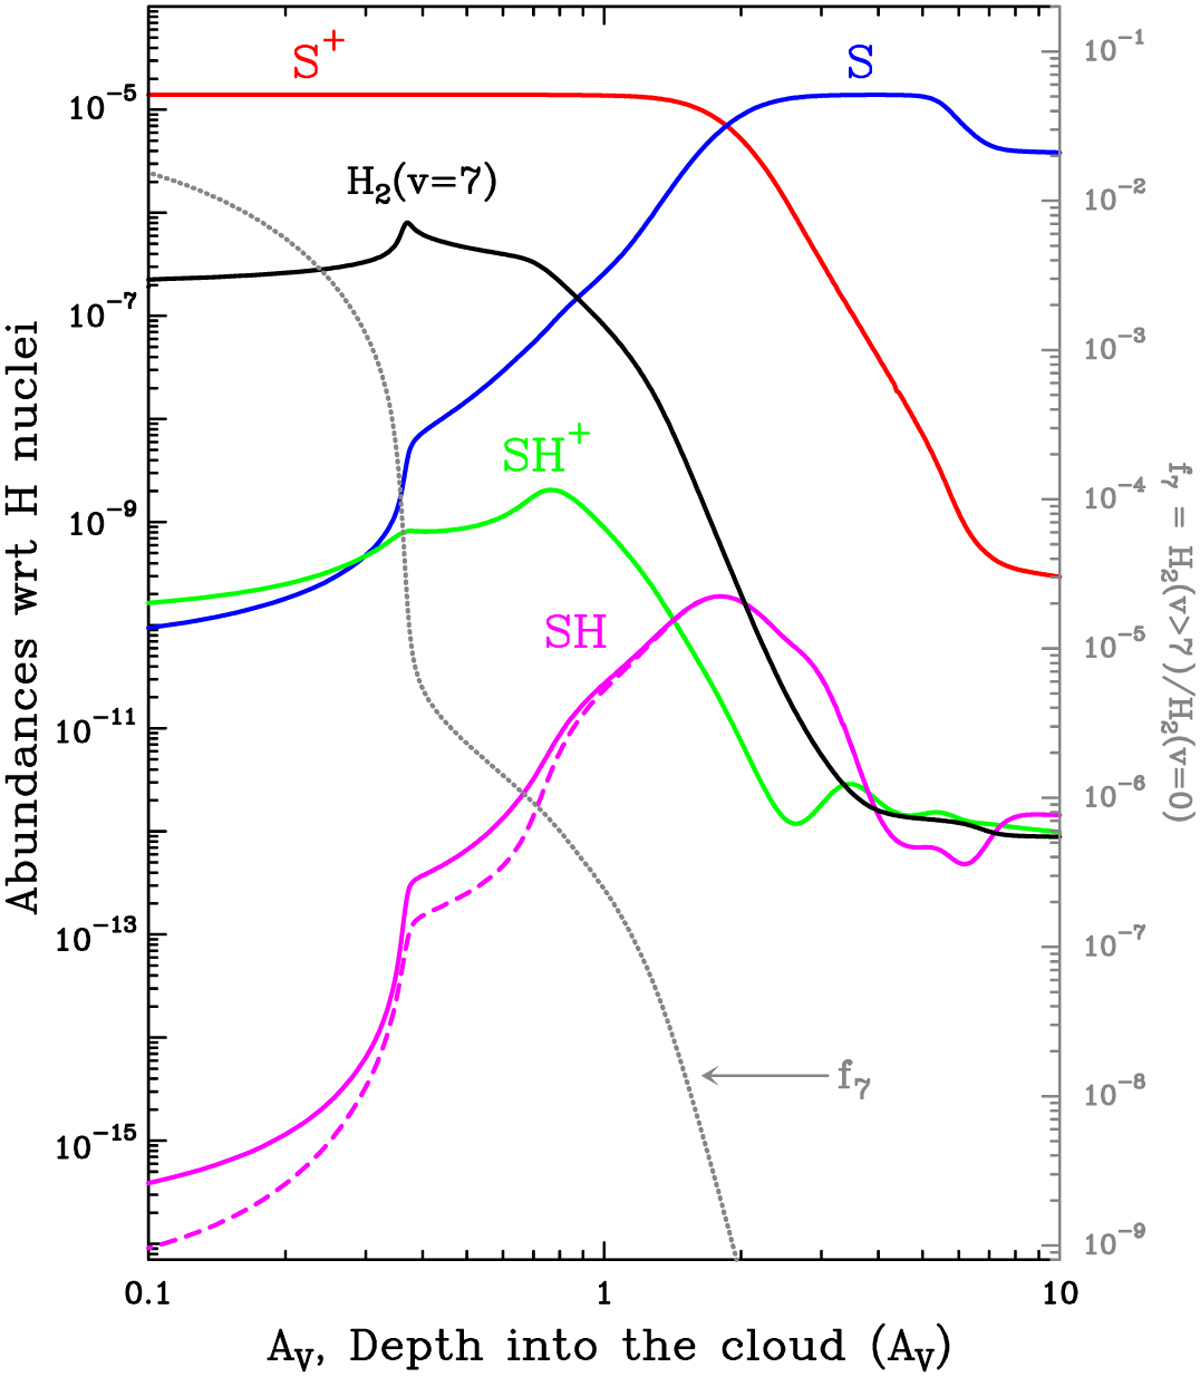
Isobaric PDR model of the Orion Bar (G0 ≃2 × 10⁴, Pth/kB = 2 × 108 cm−3 K) showing abundance profiles with respect to H nuclei. The gray dotted curve shows f7, the fraction of H2(v > 7) with respect to the ground (right axis gray scale). Solid curves refer to a model using state-specific reaction rates for reaction S (3P) + H2 (v) → SH + H, whereas dashed curves refer to a model using the thermal rate.
Current usage metrics show cumulative count of Article Views (full-text article views including HTML views, PDF and ePub downloads, according to the available data) and Abstracts Views on Vision4Press platform.
Data correspond to usage on the plateform after 2015. The current usage metrics is available 48-96 hours after online publication and is updated daily on week days.
Initial download of the metrics may take a while.