Fig. 4.
Download original image
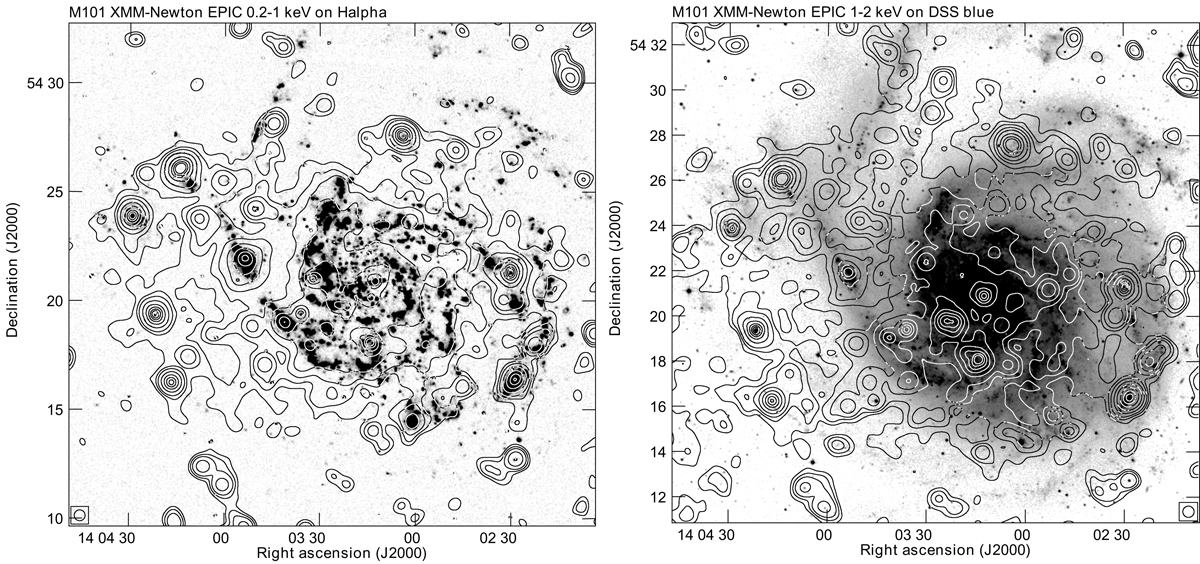
Maps of X-ray emission from M 101. Left: soft-band (0.2−1 keV) overlaid on an Hα image. The contours are 3, 6, 12, 24, 48, and 96 × rms. The map is adaptively smoothed with the largest scale of 30″. Right: medium-band (1−2 keV) overlaid on a DSS blue image. The contours are 3, 6, 12, 24, 48, and 96 × rms. The map is adaptively smoothed with the largest scale of 30″, which is shown in the bottom corners of the maps.
Current usage metrics show cumulative count of Article Views (full-text article views including HTML views, PDF and ePub downloads, according to the available data) and Abstracts Views on Vision4Press platform.
Data correspond to usage on the plateform after 2015. The current usage metrics is available 48-96 hours after online publication and is updated daily on week days.
Initial download of the metrics may take a while.