Fig. 3.
Download original image
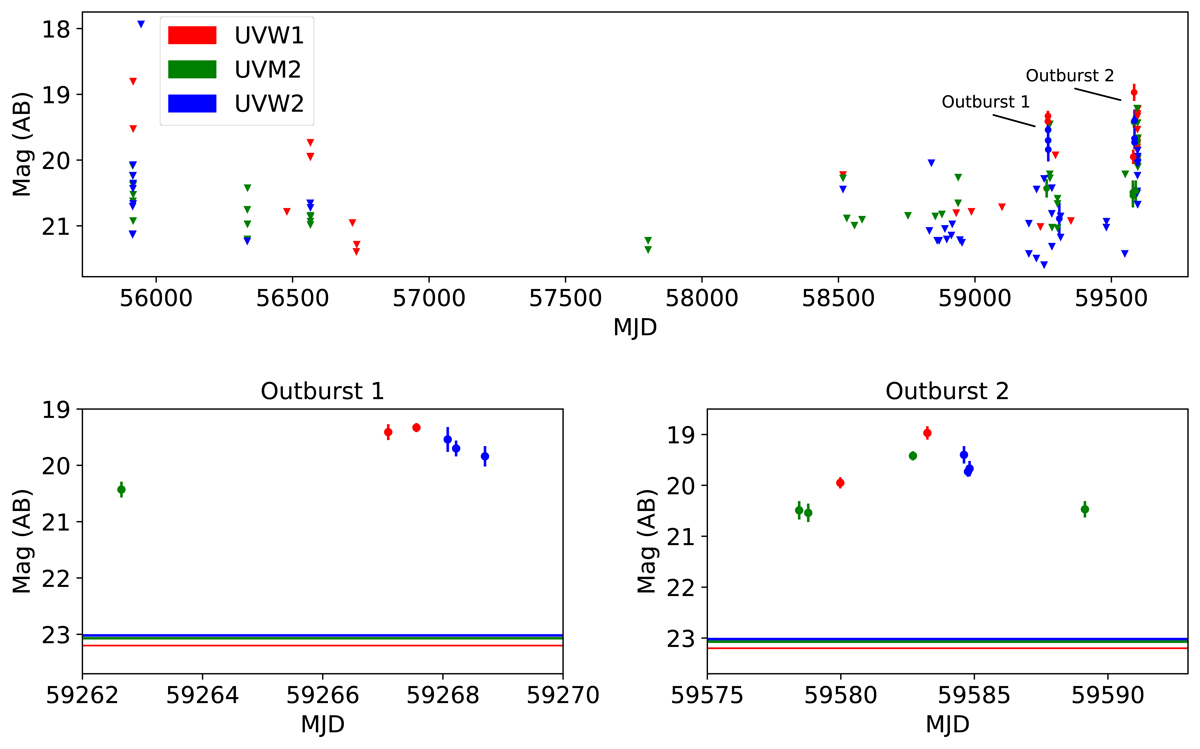
UVOT light curves of TUVO-21acq. Upper panel: long-term light curve, created using all UVOT data covering the position of the source in all three UV filters. Data from optical filters are not shown for aesthetic purposes, as very few images were obtained in these filters and only weak upper limits were found (i.e. no detections). Lower panels: zoomed-in views of the two outburst segments that are labelled in the top panel. Horizontal lines indicate the quiescence level (see Sect. 2.3.1). Triangles indicate upper limits (indicating that the source was not detected at ≥3σ).
Current usage metrics show cumulative count of Article Views (full-text article views including HTML views, PDF and ePub downloads, according to the available data) and Abstracts Views on Vision4Press platform.
Data correspond to usage on the plateform after 2015. The current usage metrics is available 48-96 hours after online publication and is updated daily on week days.
Initial download of the metrics may take a while.