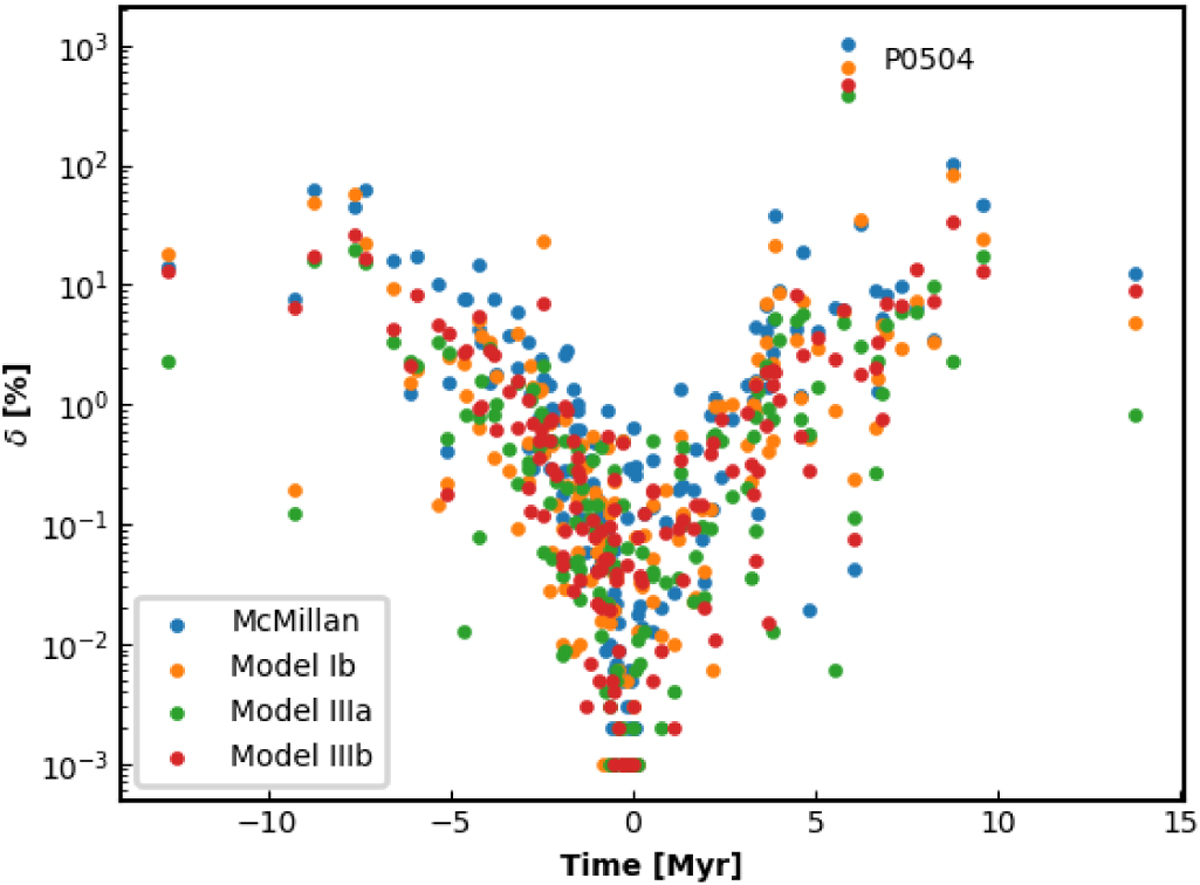
Fig. 4

Download original image
Relative difference in percent of the minimum star-Sun distance between our reference model Ia and four other Galactic potential models described in the text. Horizontal axis describe the epoch of a close encounter. Points in the same colour represent all 155 stars on our list, the colours represent four models of Galactic potential as explained in the picture.
Current usage metrics show cumulative count of Article Views (full-text article views including HTML views, PDF and ePub downloads, according to the available data) and Abstracts Views on Vision4Press platform.
Data correspond to usage on the plateform after 2015. The current usage metrics is available 48-96 hours after online publication and is updated daily on week days.
Initial download of the metrics may take a while.


