Open Access
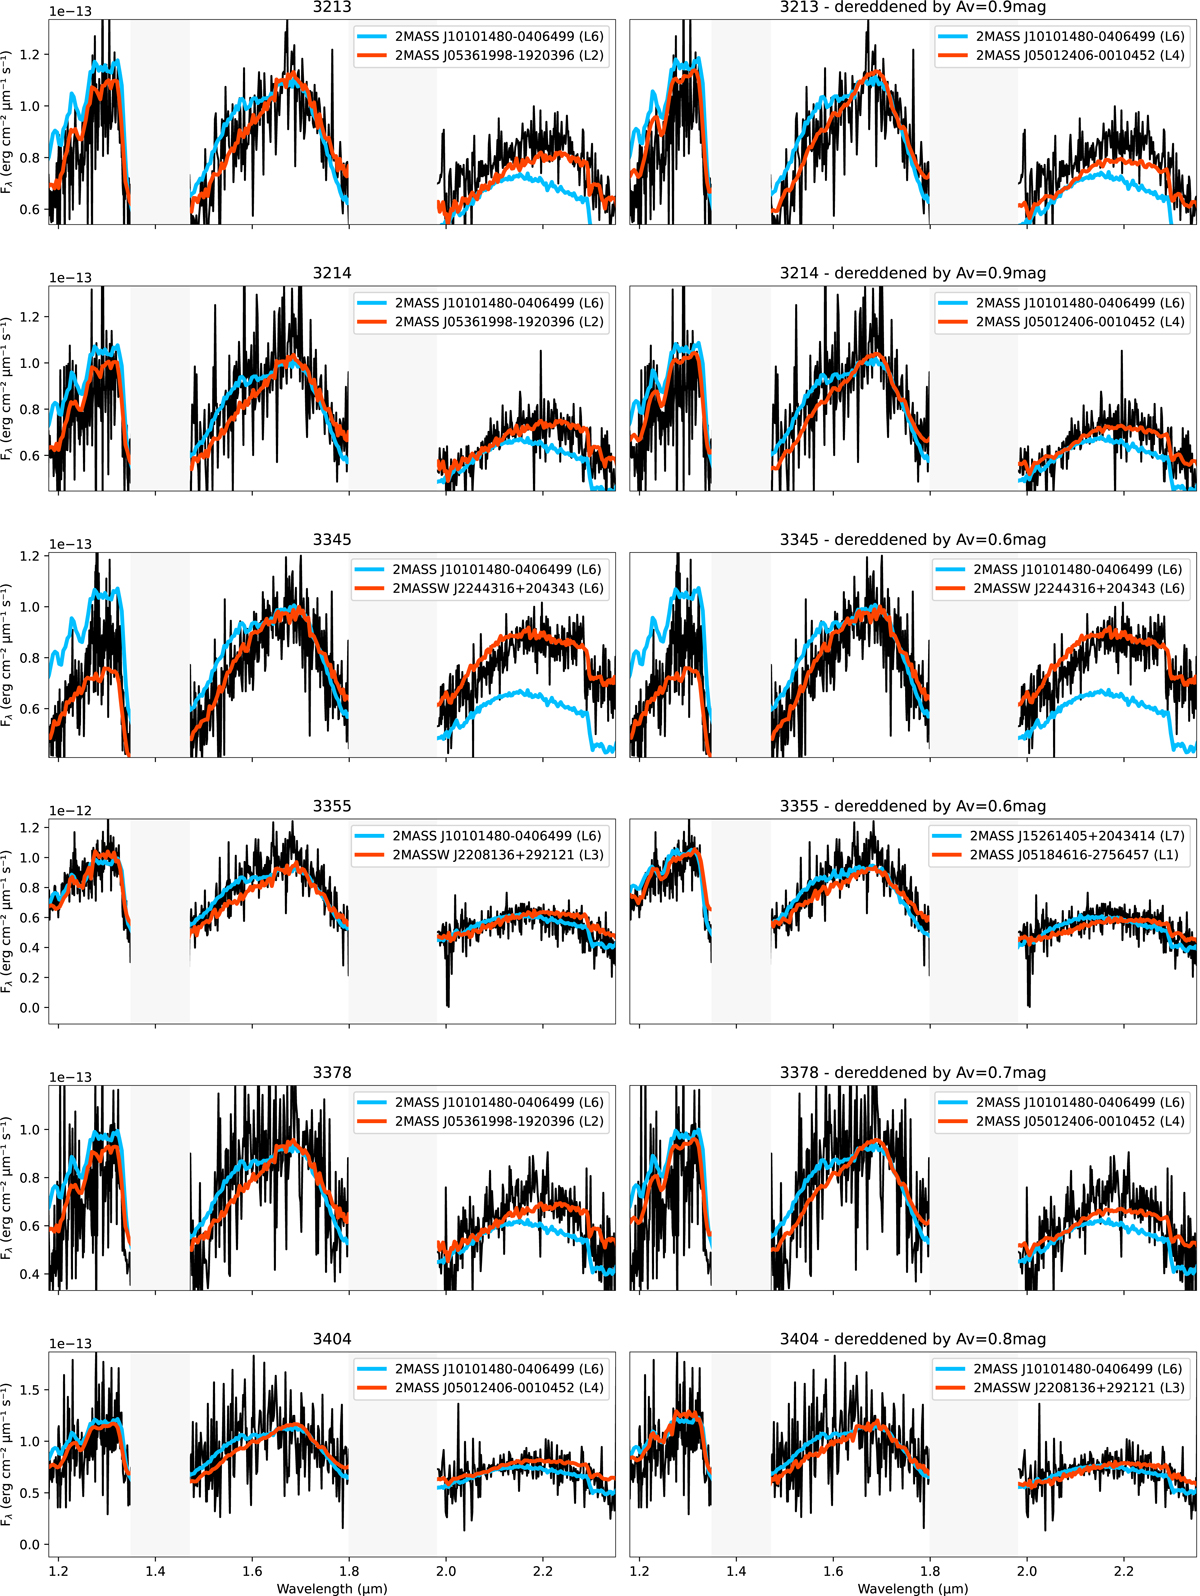
Fig. A.3.
Download original image
Comparison of our targets spectra (black) with very-low gravity standards (red) and field-gravity standards (blue). The left panels show the original spectrum, and the right panels show the spectrum derredened by the cumulative line-of-sight extinction indicated in the plot title and in Table 1.
Current usage metrics show cumulative count of Article Views (full-text article views including HTML views, PDF and ePub downloads, according to the available data) and Abstracts Views on Vision4Press platform.
Data correspond to usage on the plateform after 2015. The current usage metrics is available 48-96 hours after online publication and is updated daily on week days.
Initial download of the metrics may take a while.