Fig. B.1

Download original image
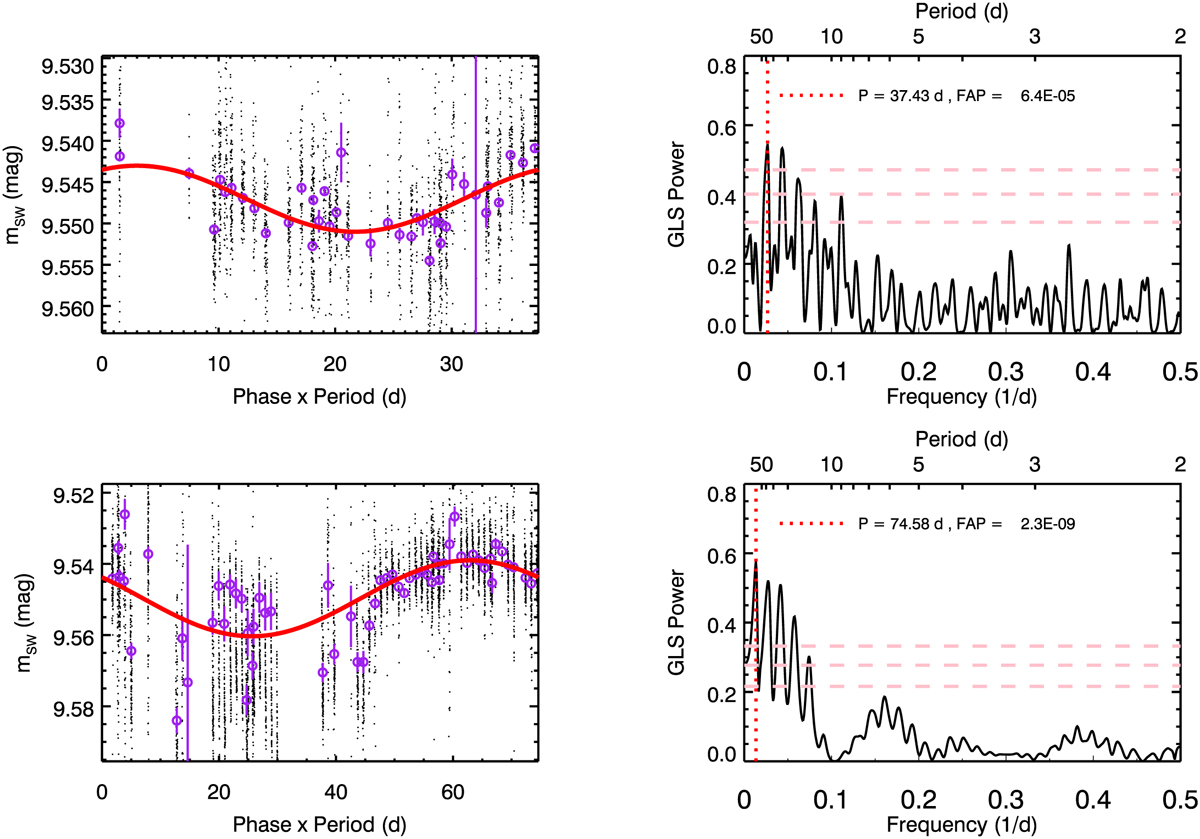
GLS analysis of light curves from SuperWASP. Left: phase-folded light curve on the most significant peak period found from each season, overplotted with the best-fit sinusoidal signal in red. Daily-binned data are shown in purple circles. Right: GLS periodogram of the data, where the highest peak is highlighted in red dotted lines. FAP levels at 10%, 1%, and 0.1% are shown in pink dashed lines. Top: 2009–10 season showing the best period at 37.4 d. Bottom: 2010–11 season showing the top peak period at 74.58d, double that of the first season. While the coverage of SuperWASP data for this star is less complete, it broadly supports the rotation period of 37.5d derived from T8 APT data.
Current usage metrics show cumulative count of Article Views (full-text article views including HTML views, PDF and ePub downloads, according to the available data) and Abstracts Views on Vision4Press platform.
Data correspond to usage on the plateform after 2015. The current usage metrics is available 48-96 hours after online publication and is updated daily on week days.
Initial download of the metrics may take a while.


