Fig. 12
Download original image
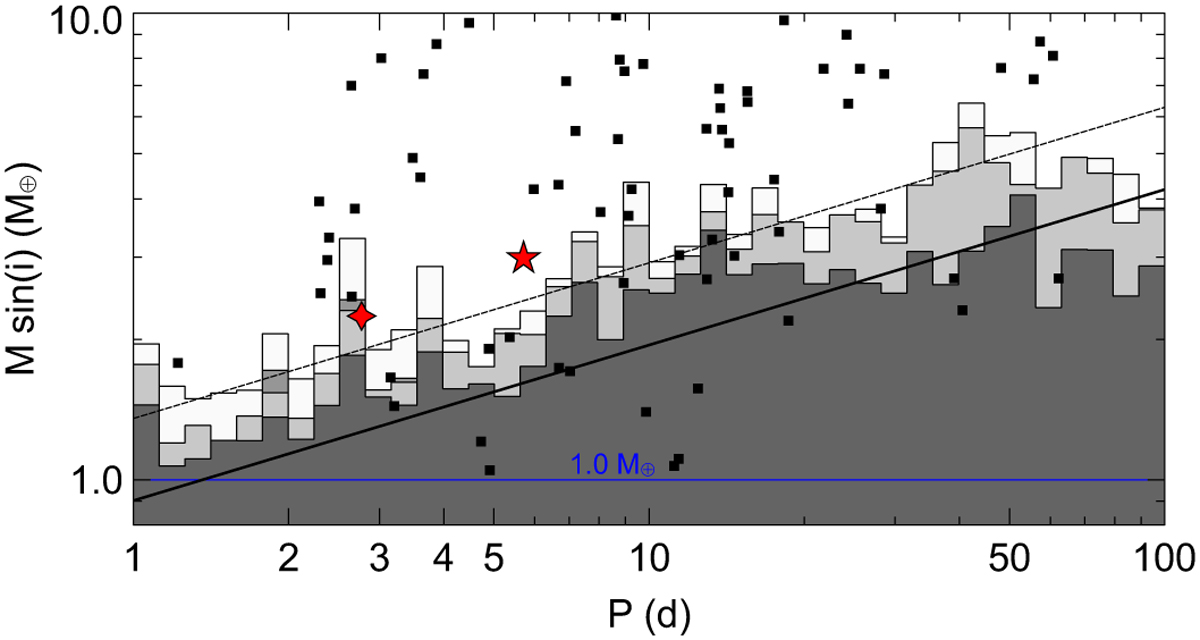
Maximum M sin i value compatible with the RV measurements as a function of prospective orbital period. From light to darker gray: detectability from original RV data (no modeling of planets or activity), data corrected for the signal of the two planets, and data corrected for activity with GP and the two planets. The horizontal blue line shows the signal expected for 1.0 M⊕ planets. The two diagonal black lines show masses corresponding to semi-amplitudes of 1.0 and 1.5 m s−1 in the RVs. Small black squares represent exoplanets around M dwarfs from exoplanet.eu with mass determinations from RVs. Red symbols represent HD 260655 b (four-point star) and c (five-point star).
Current usage metrics show cumulative count of Article Views (full-text article views including HTML views, PDF and ePub downloads, according to the available data) and Abstracts Views on Vision4Press platform.
Data correspond to usage on the plateform after 2015. The current usage metrics is available 48-96 hours after online publication and is updated daily on week days.
Initial download of the metrics may take a while.