Fig. 2
Download original image
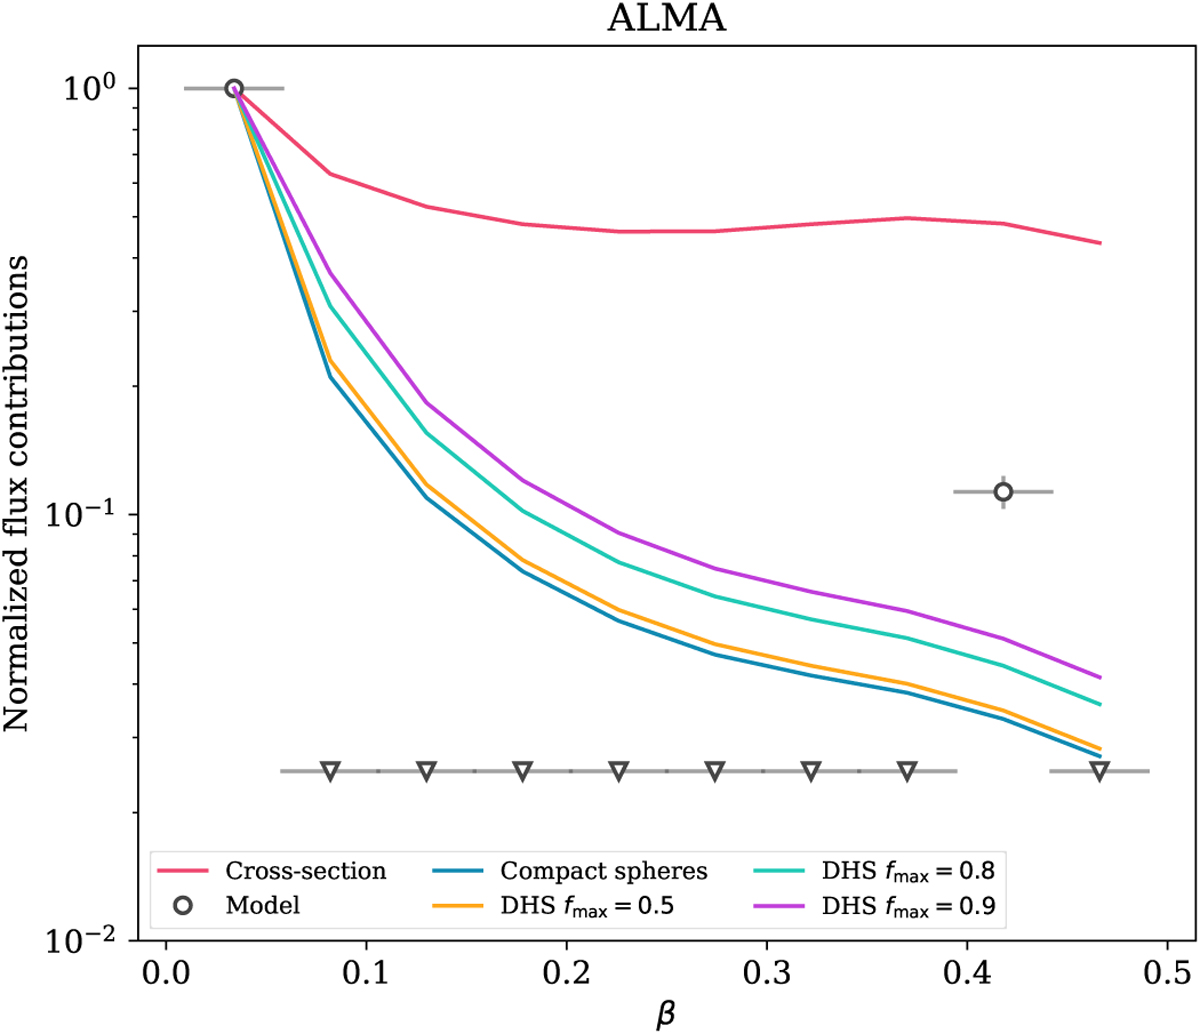
Normalized flux contributions as a function of β for the ALMA observations. The red line shows the contributions derived from the cross-section model. The open symbols show the contributions of the β intervals for the best fit model when relaxing the assumption on the grain size distribution. The values that are below 2.5 × 10⁻² are considered as upper limits, and are represented by downward triangles. The horizontal bars show the width of the β intervals, and the vertical bars are the lσ confidence interval. The other solid lines show the contributions for models that account for the optical properties of the particles (see text for details).
Current usage metrics show cumulative count of Article Views (full-text article views including HTML views, PDF and ePub downloads, according to the available data) and Abstracts Views on Vision4Press platform.
Data correspond to usage on the plateform after 2015. The current usage metrics is available 48-96 hours after online publication and is updated daily on week days.
Initial download of the metrics may take a while.