Fig. 1
Download original image
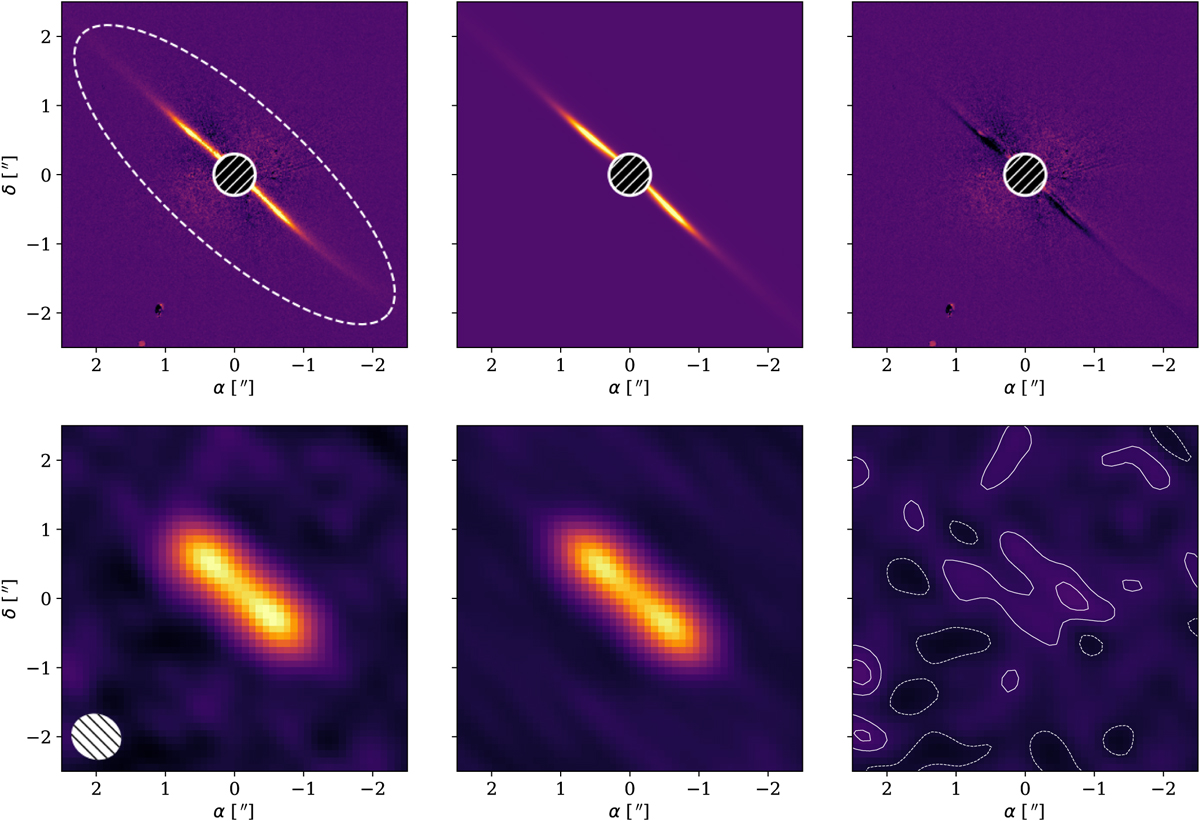
From left to right: observations, best fit model, and residuals, for the SPHERE and ALMA observations (top and bottom, respectively). The scaling is linear and the same for all horizontal panels. For the ALMA observations, the beam is shown in the leftmost panel, and the contours on the right panel are at [–1,1,2] σ (σ = 0.3 mJy beam−1).
Current usage metrics show cumulative count of Article Views (full-text article views including HTML views, PDF and ePub downloads, according to the available data) and Abstracts Views on Vision4Press platform.
Data correspond to usage on the plateform after 2015. The current usage metrics is available 48-96 hours after online publication and is updated daily on week days.
Initial download of the metrics may take a while.