Fig. 4.
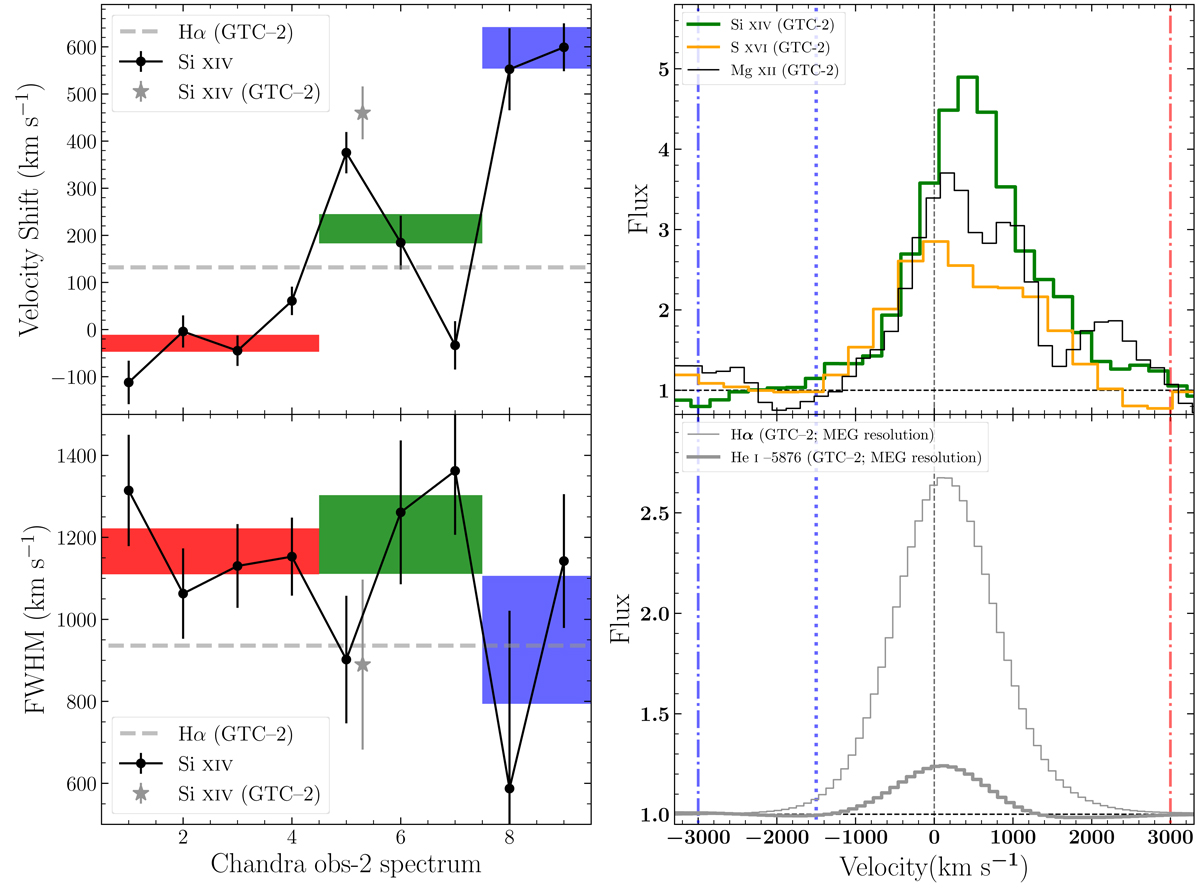
Download original image
Emission line properties during obs-2. Left panels: velocity offset of Si XIV (top-left). The coloured horizontal bands mark the results for obs-2.A, obs-2.B and obs-2.C (with their velocity width representing ±1σ errors). The colour code is the same as in Fig. 1. The evolution of the FWHM is presented in the bottom-left panel, where the horizontal dashed lines indicate the FWHM of Hα during GTC-2. The Si XIV measurement obtained during GTC-2 (i.e. top-right) is indicated by a star. Right panels: emission line profiles (in velocity scale) of Mg XII, Si XIV, S XVI (top-right); Hα and He I (bottom-right) during GTC-2. For an easier visual comparison, the velocity resolution of the optical lines has been degraded to that of Chandra. The vertical lines are the same as in Fig. 2.
Current usage metrics show cumulative count of Article Views (full-text article views including HTML views, PDF and ePub downloads, according to the available data) and Abstracts Views on Vision4Press platform.
Data correspond to usage on the plateform after 2015. The current usage metrics is available 48-96 hours after online publication and is updated daily on week days.
Initial download of the metrics may take a while.