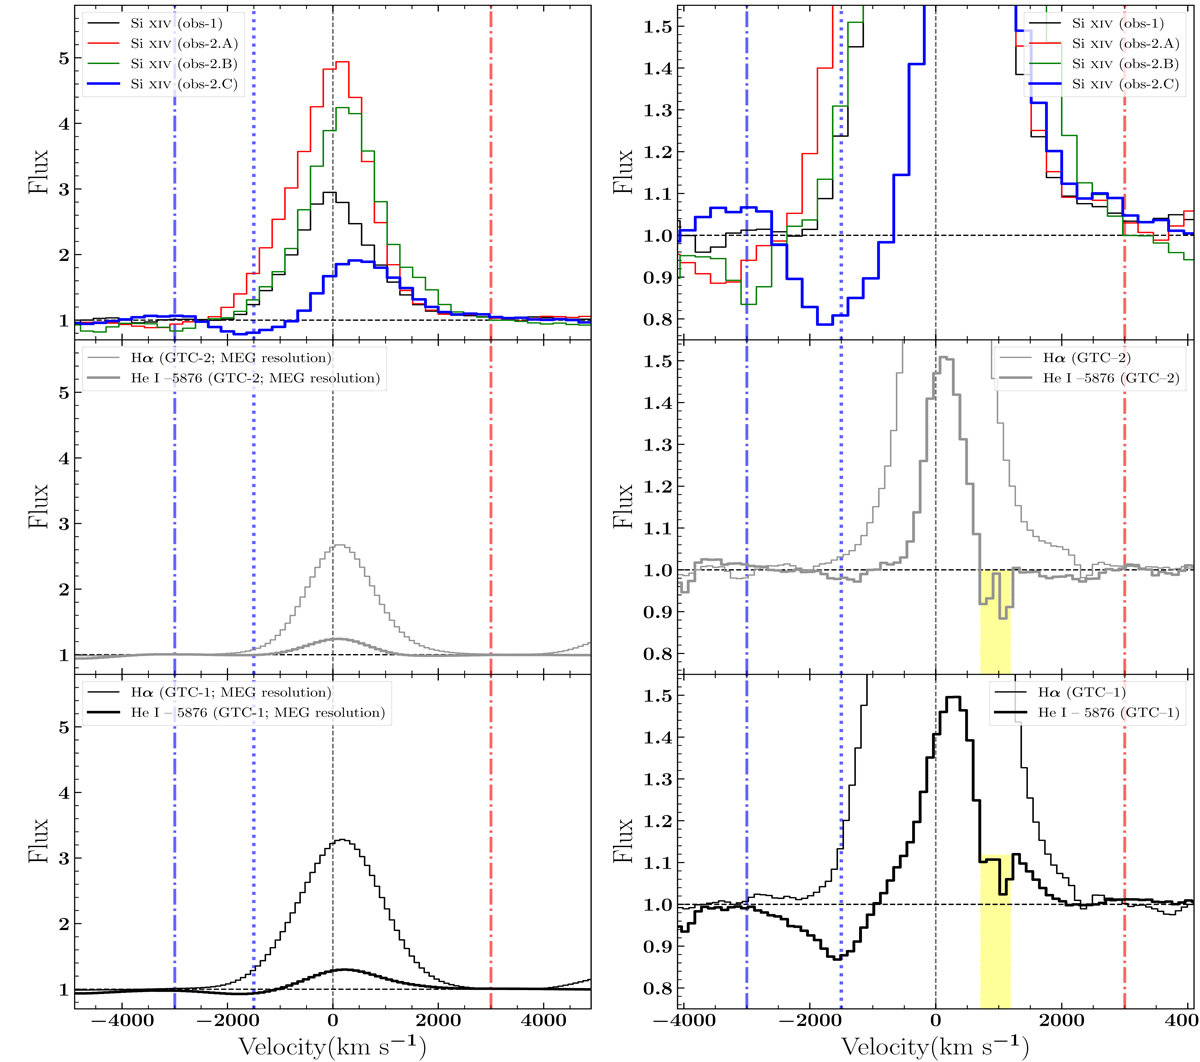
Fig. 2.
Download original image
Chandra spectra of Si XIV (top panels) compared with GTC spectroscopy in the He I and Hα regions (mid and bottom panels). The right panels are zoomed version of the left ones aimed at highlighting the blue-shifted absorption features. Dotted vertical lines mark the core velocity (−1500 km s−1) of the He I absorption component, while the dotted-dashed vertical lines mark (approximately) its blue-edge velocity (blue; −3000 km s−1) and the corresponding receding velocity (red; 3000 km s−1).
Current usage metrics show cumulative count of Article Views (full-text article views including HTML views, PDF and ePub downloads, according to the available data) and Abstracts Views on Vision4Press platform.
Data correspond to usage on the plateform after 2015. The current usage metrics is available 48-96 hours after online publication and is updated daily on week days.
Initial download of the metrics may take a while.