Fig. 1.
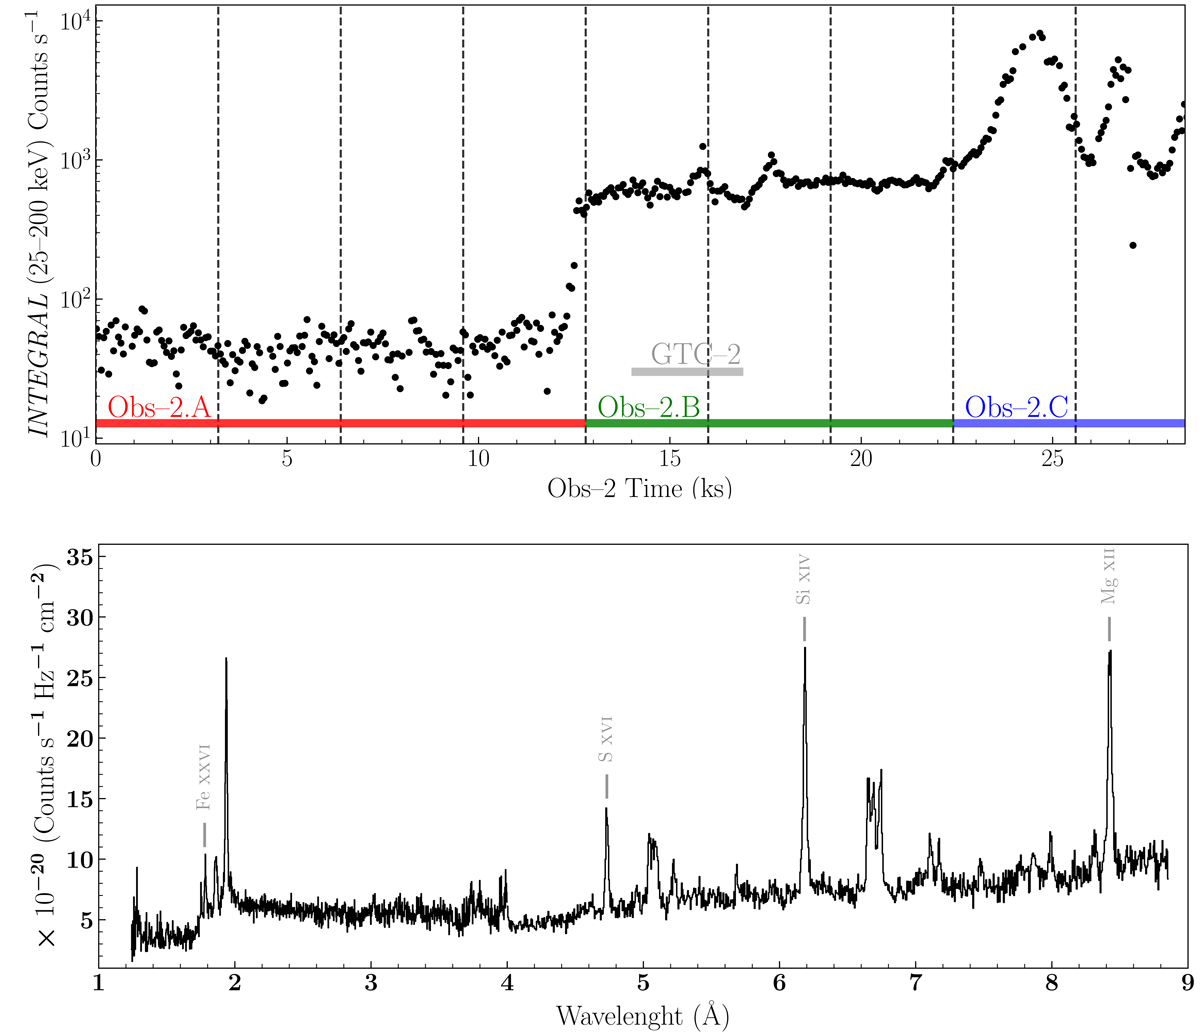
Download original image
Hard X-ray light curve and Chandra spectrum during obs-2. Top panel: INTEGRAL light curve. The dashed vertical lines indicates the boundaries of the 3.2 ks spectra (also used in K15). Following the hard X-ray evolution, we have divided the observation into three intervals: obs-2.A (spectra 1–4; low flux), obs-2.B (5–7; plateau), and obs-2.C (8–9; flares). Bottom panel: combined MEG+HEG spectrum. We have labelled the emission lines included in this analysis (see Sect. 3).
Current usage metrics show cumulative count of Article Views (full-text article views including HTML views, PDF and ePub downloads, according to the available data) and Abstracts Views on Vision4Press platform.
Data correspond to usage on the plateform after 2015. The current usage metrics is available 48-96 hours after online publication and is updated daily on week days.
Initial download of the metrics may take a while.