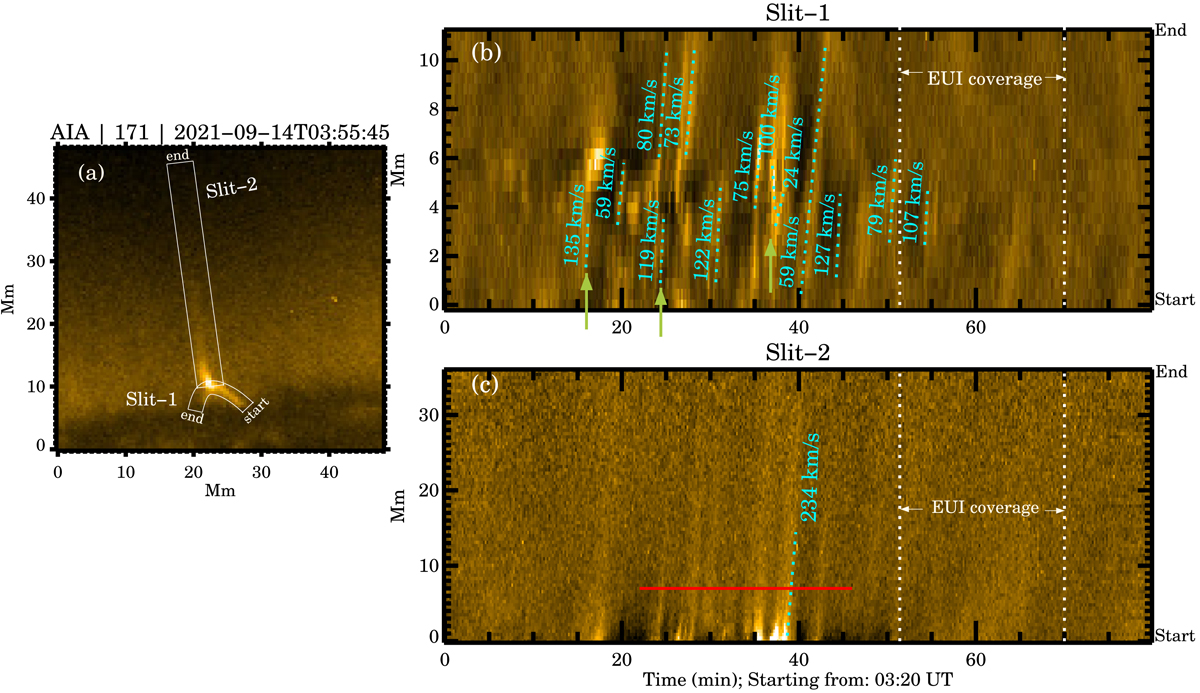
Fig. 3.
Download original image
Space-time (X-T) analysis using the AIA 171 Å image sequence. Panel a: a context image from AIA along with the two artificial slits (white boxes) that we used to derive the X-T maps. Derived maps are shown in panel b for Slit 1 and in panel c for Slit 2. In each of these maps, the slanted, dotted lines (in blue) trace the inclined ridges that correspond to propagating features. Speeds calculated through the slopes of these dotted lines are printed on the panels. Furthermore, two dotted, vertical lines (in white) mark the time period when EUI observations are available, wherein the red horizontal line in panel c marks the location at which the light curve was extracted for wavelet analysis. See Sect. 3.2.2 for further details.
Current usage metrics show cumulative count of Article Views (full-text article views including HTML views, PDF and ePub downloads, according to the available data) and Abstracts Views on Vision4Press platform.
Data correspond to usage on the plateform after 2015. The current usage metrics is available 48-96 hours after online publication and is updated daily on week days.
Initial download of the metrics may take a while.