Open Access
Fig. 7.
Download original image
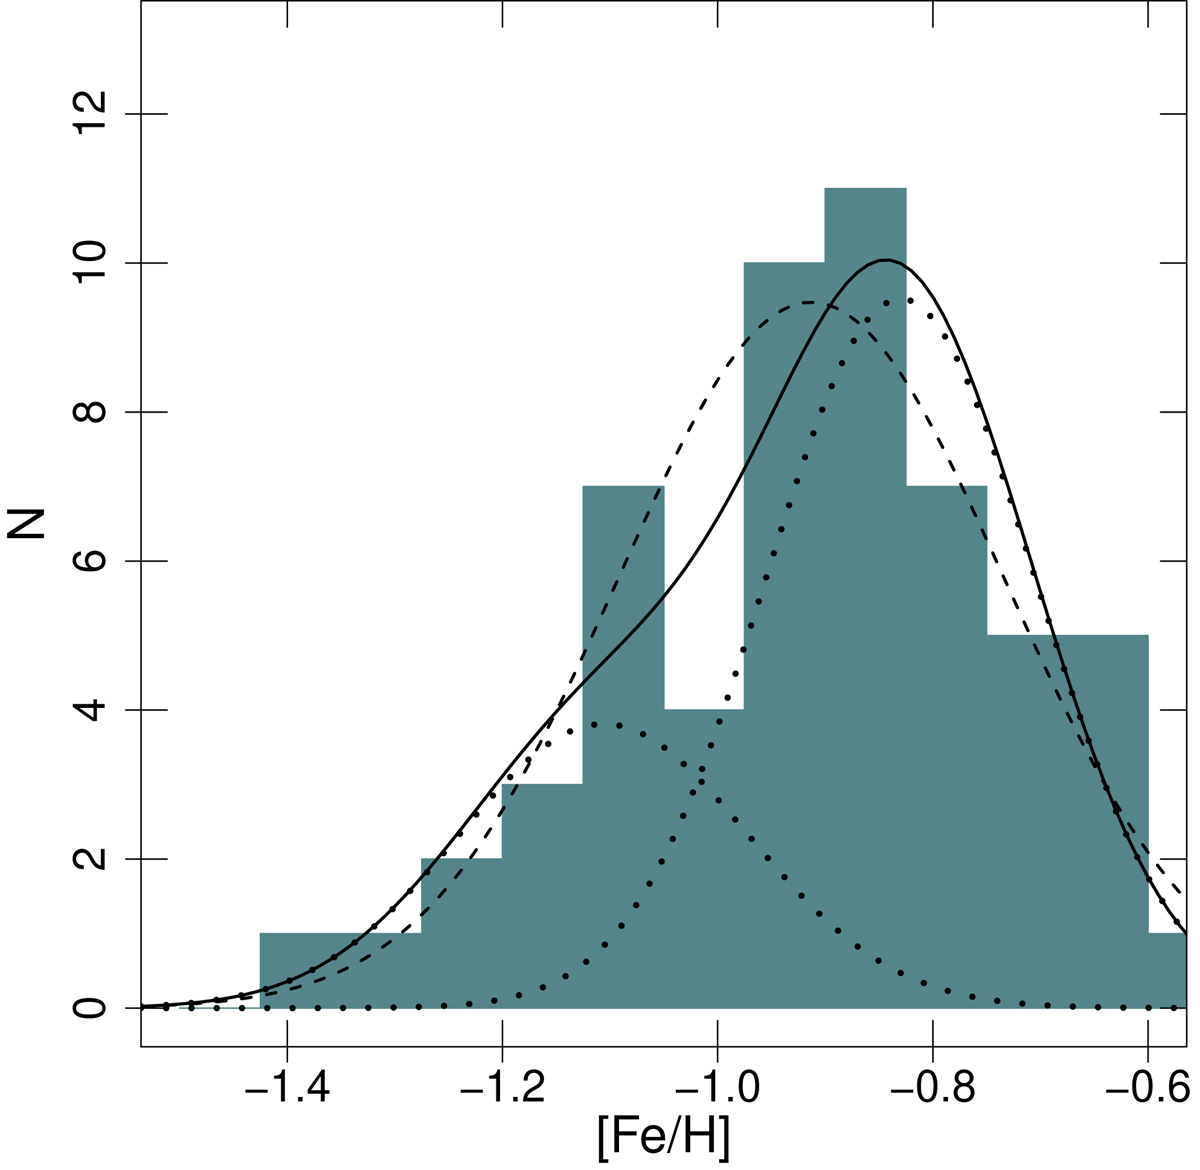
Metallicity distribution of the enlarged cluster sample. The dotted lines are the two fitted Gaussian functions according to the results from the GMM test and the solid line shows their sum. The dashed line shows the fitted Gaussian in the unimodal case.
Current usage metrics show cumulative count of Article Views (full-text article views including HTML views, PDF and ePub downloads, according to the available data) and Abstracts Views on Vision4Press platform.
Data correspond to usage on the plateform after 2015. The current usage metrics is available 48-96 hours after online publication and is updated daily on week days.
Initial download of the metrics may take a while.