Open Access
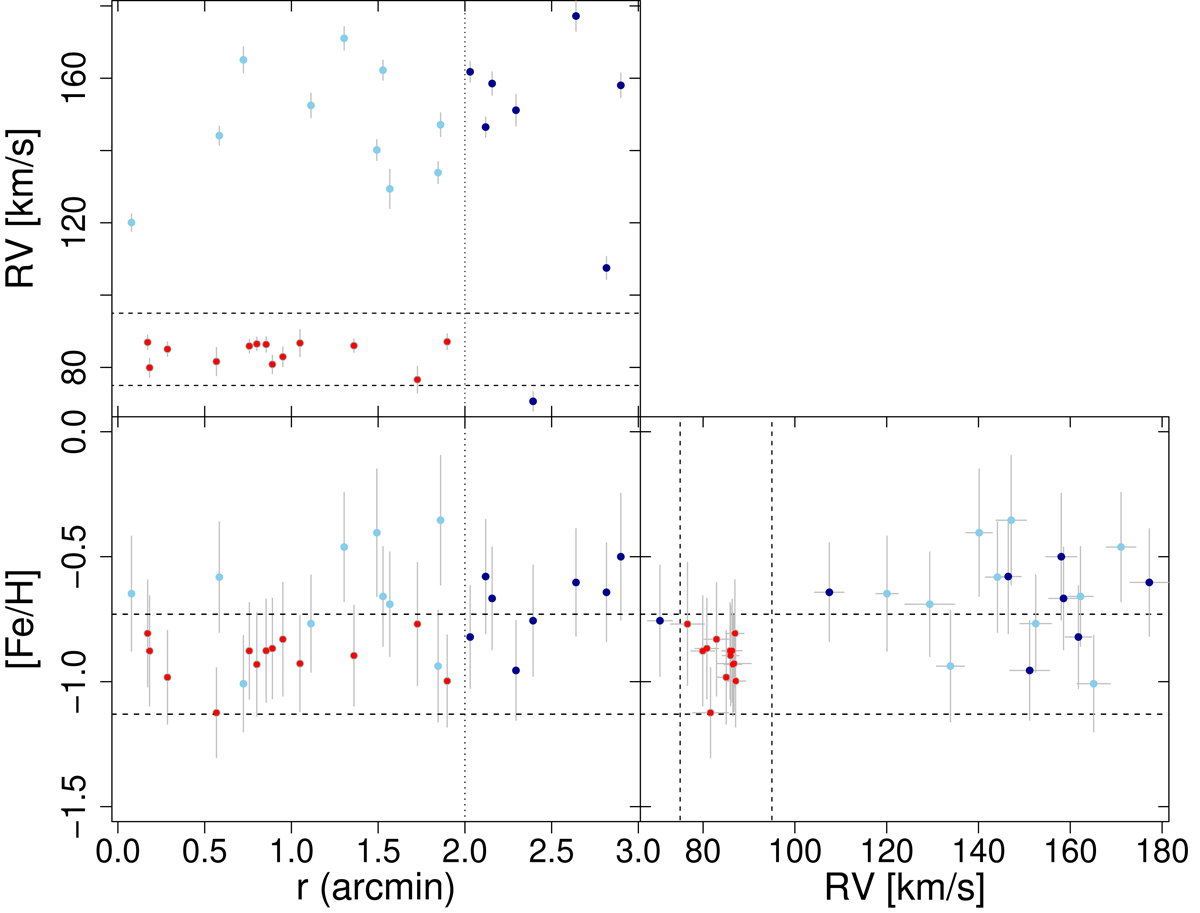
Fig. 6.
Download original image
Membership analysis for the cluster K 38. The color-coding is the same as in Fig. 2. The cluster radius is shown by the dotted vertical line and the dashed lines represent the adopted RV and metallicity cuts.
Current usage metrics show cumulative count of Article Views (full-text article views including HTML views, PDF and ePub downloads, according to the available data) and Abstracts Views on Vision4Press platform.
Data correspond to usage on the plateform after 2015. The current usage metrics is available 48-96 hours after online publication and is updated daily on week days.
Initial download of the metrics may take a while.