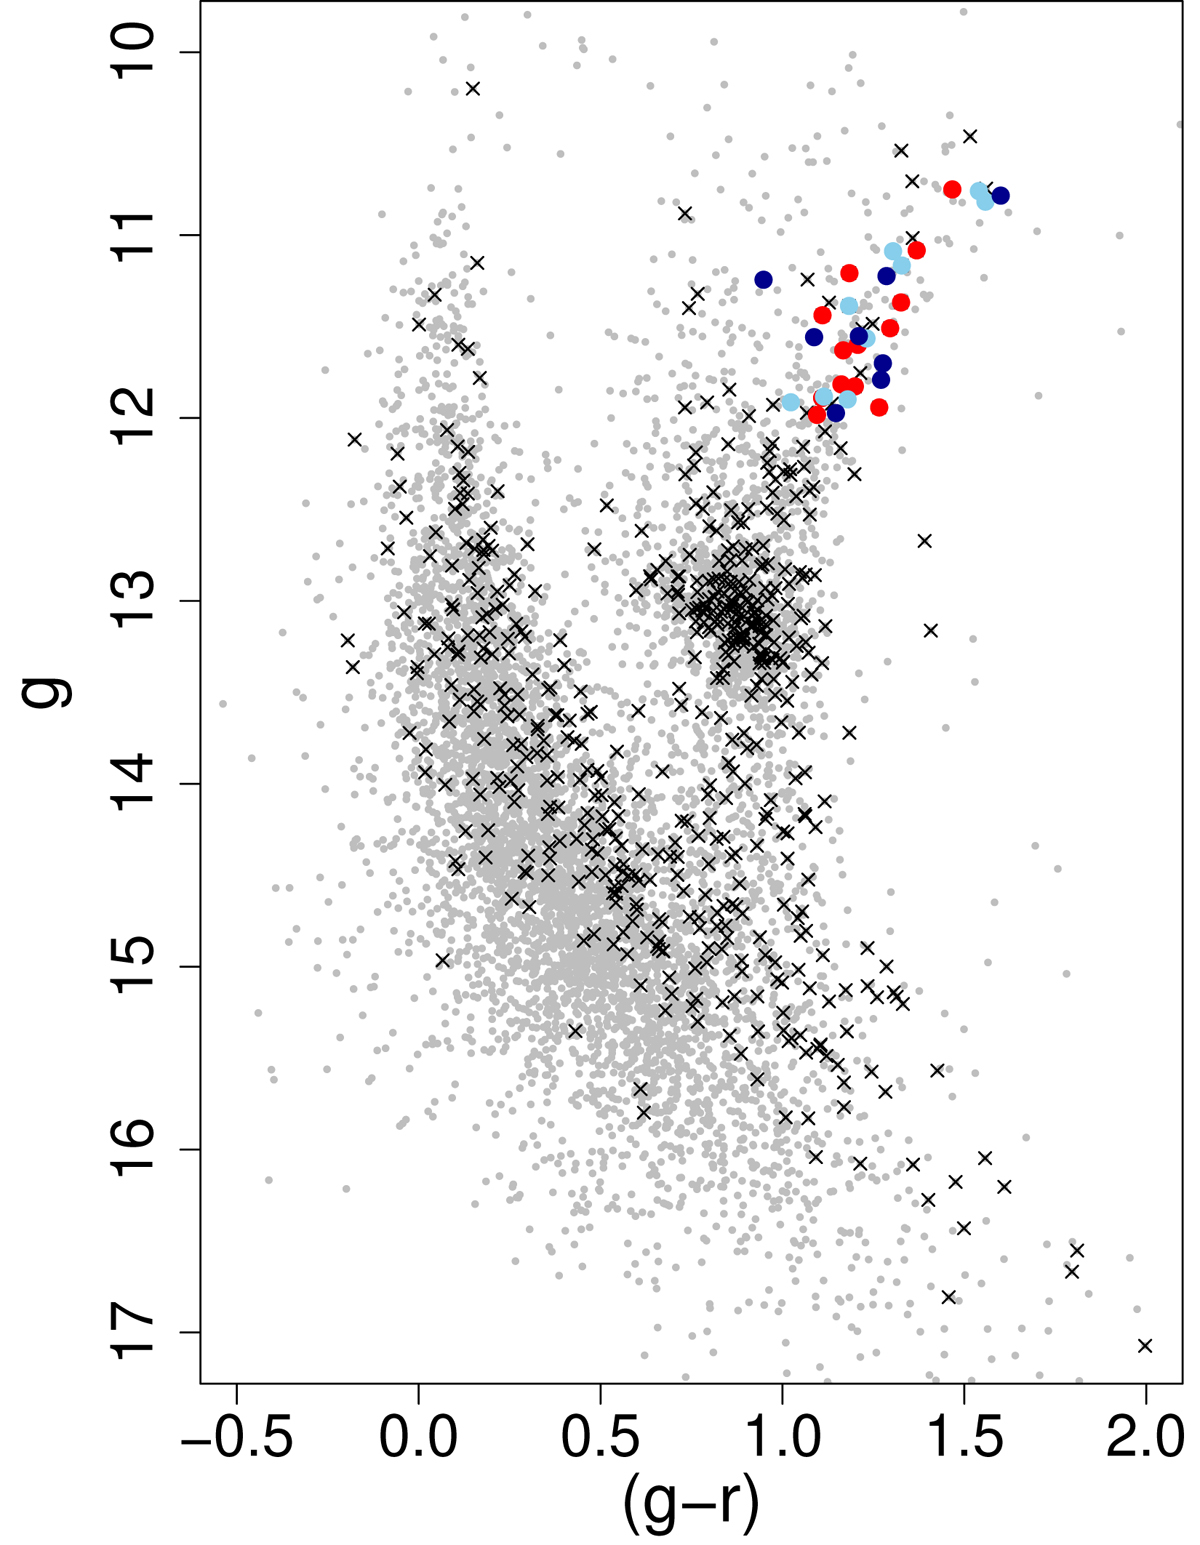
Fig. 2.
Download original image
Color-magnitude diagram of the cluster K 38. The small gray circles show all the objects located in the corresponding frame. The black crosses are the objects located inside the cluster radius. The blue, cyan and green symbols represent targets discarded due to their distance from the cluster center, RV and metallicity, respectively. The red circles are cluster members according to our membership analysis (see Sect. 4 for details).
Current usage metrics show cumulative count of Article Views (full-text article views including HTML views, PDF and ePub downloads, according to the available data) and Abstracts Views on Vision4Press platform.
Data correspond to usage on the plateform after 2015. The current usage metrics is available 48-96 hours after online publication and is updated daily on week days.
Initial download of the metrics may take a while.