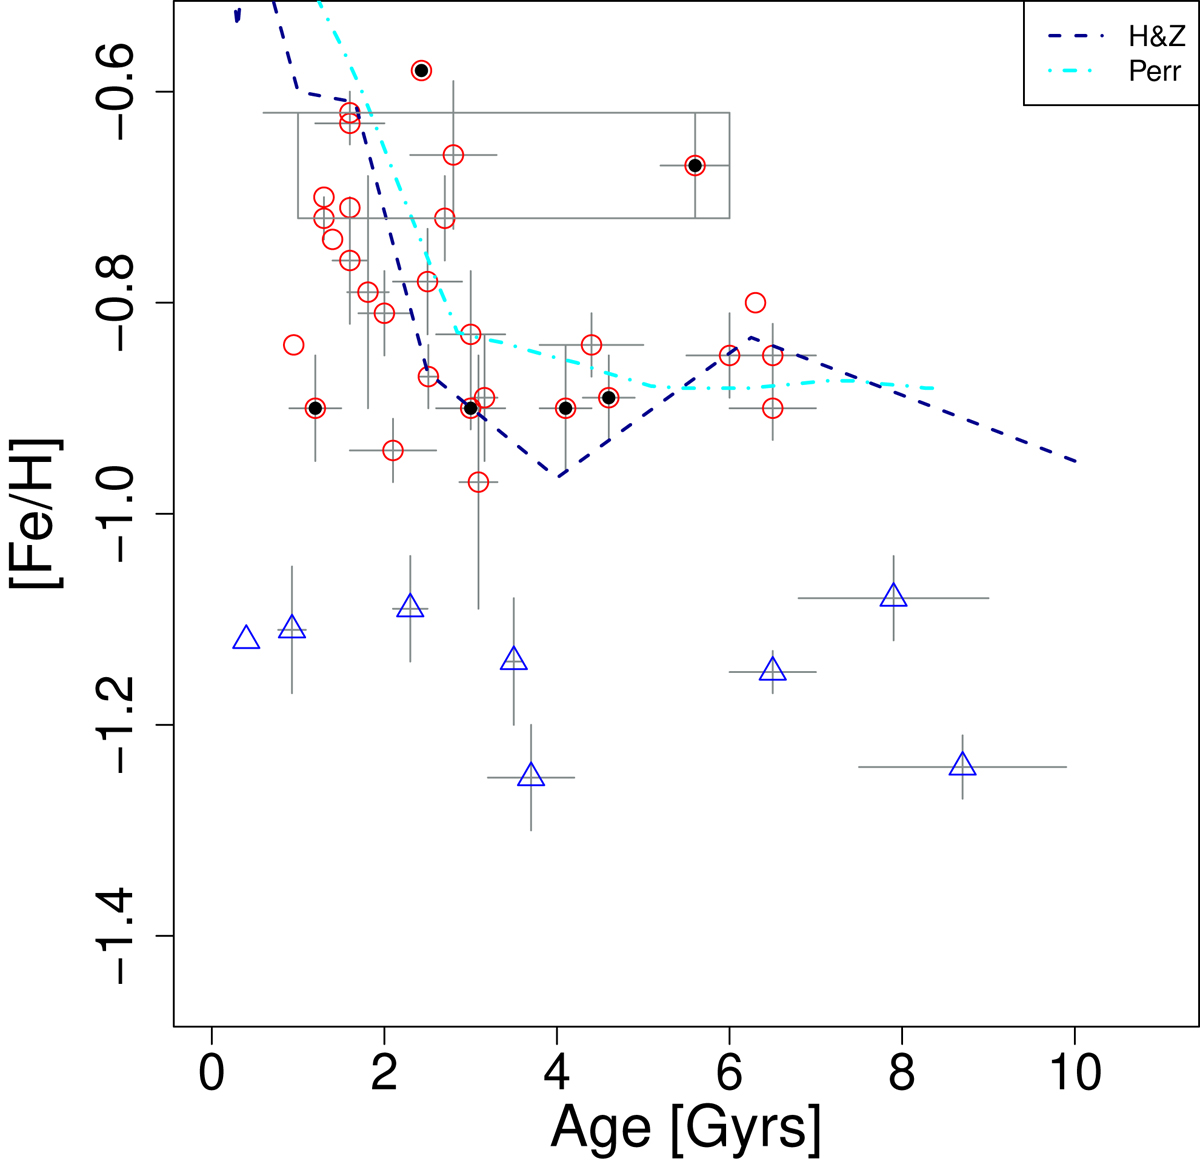
Fig. 13.
Download original image
Age-metallicity relation inside 3.4°. The red circles and blue triangles show clusters corresponding to the metal-rich and metal-poor groups, respectively. The six clusters studied in this work are represented with filled symbols. The references for the AMR models are the same as in Fig. 12. The cluster HW41 has been plotted within a rectangle that represents the range of ages that can be found in the literature for this cluster (see text for details).
Current usage metrics show cumulative count of Article Views (full-text article views including HTML views, PDF and ePub downloads, according to the available data) and Abstracts Views on Vision4Press platform.
Data correspond to usage on the plateform after 2015. The current usage metrics is available 48-96 hours after online publication and is updated daily on week days.
Initial download of the metrics may take a while.