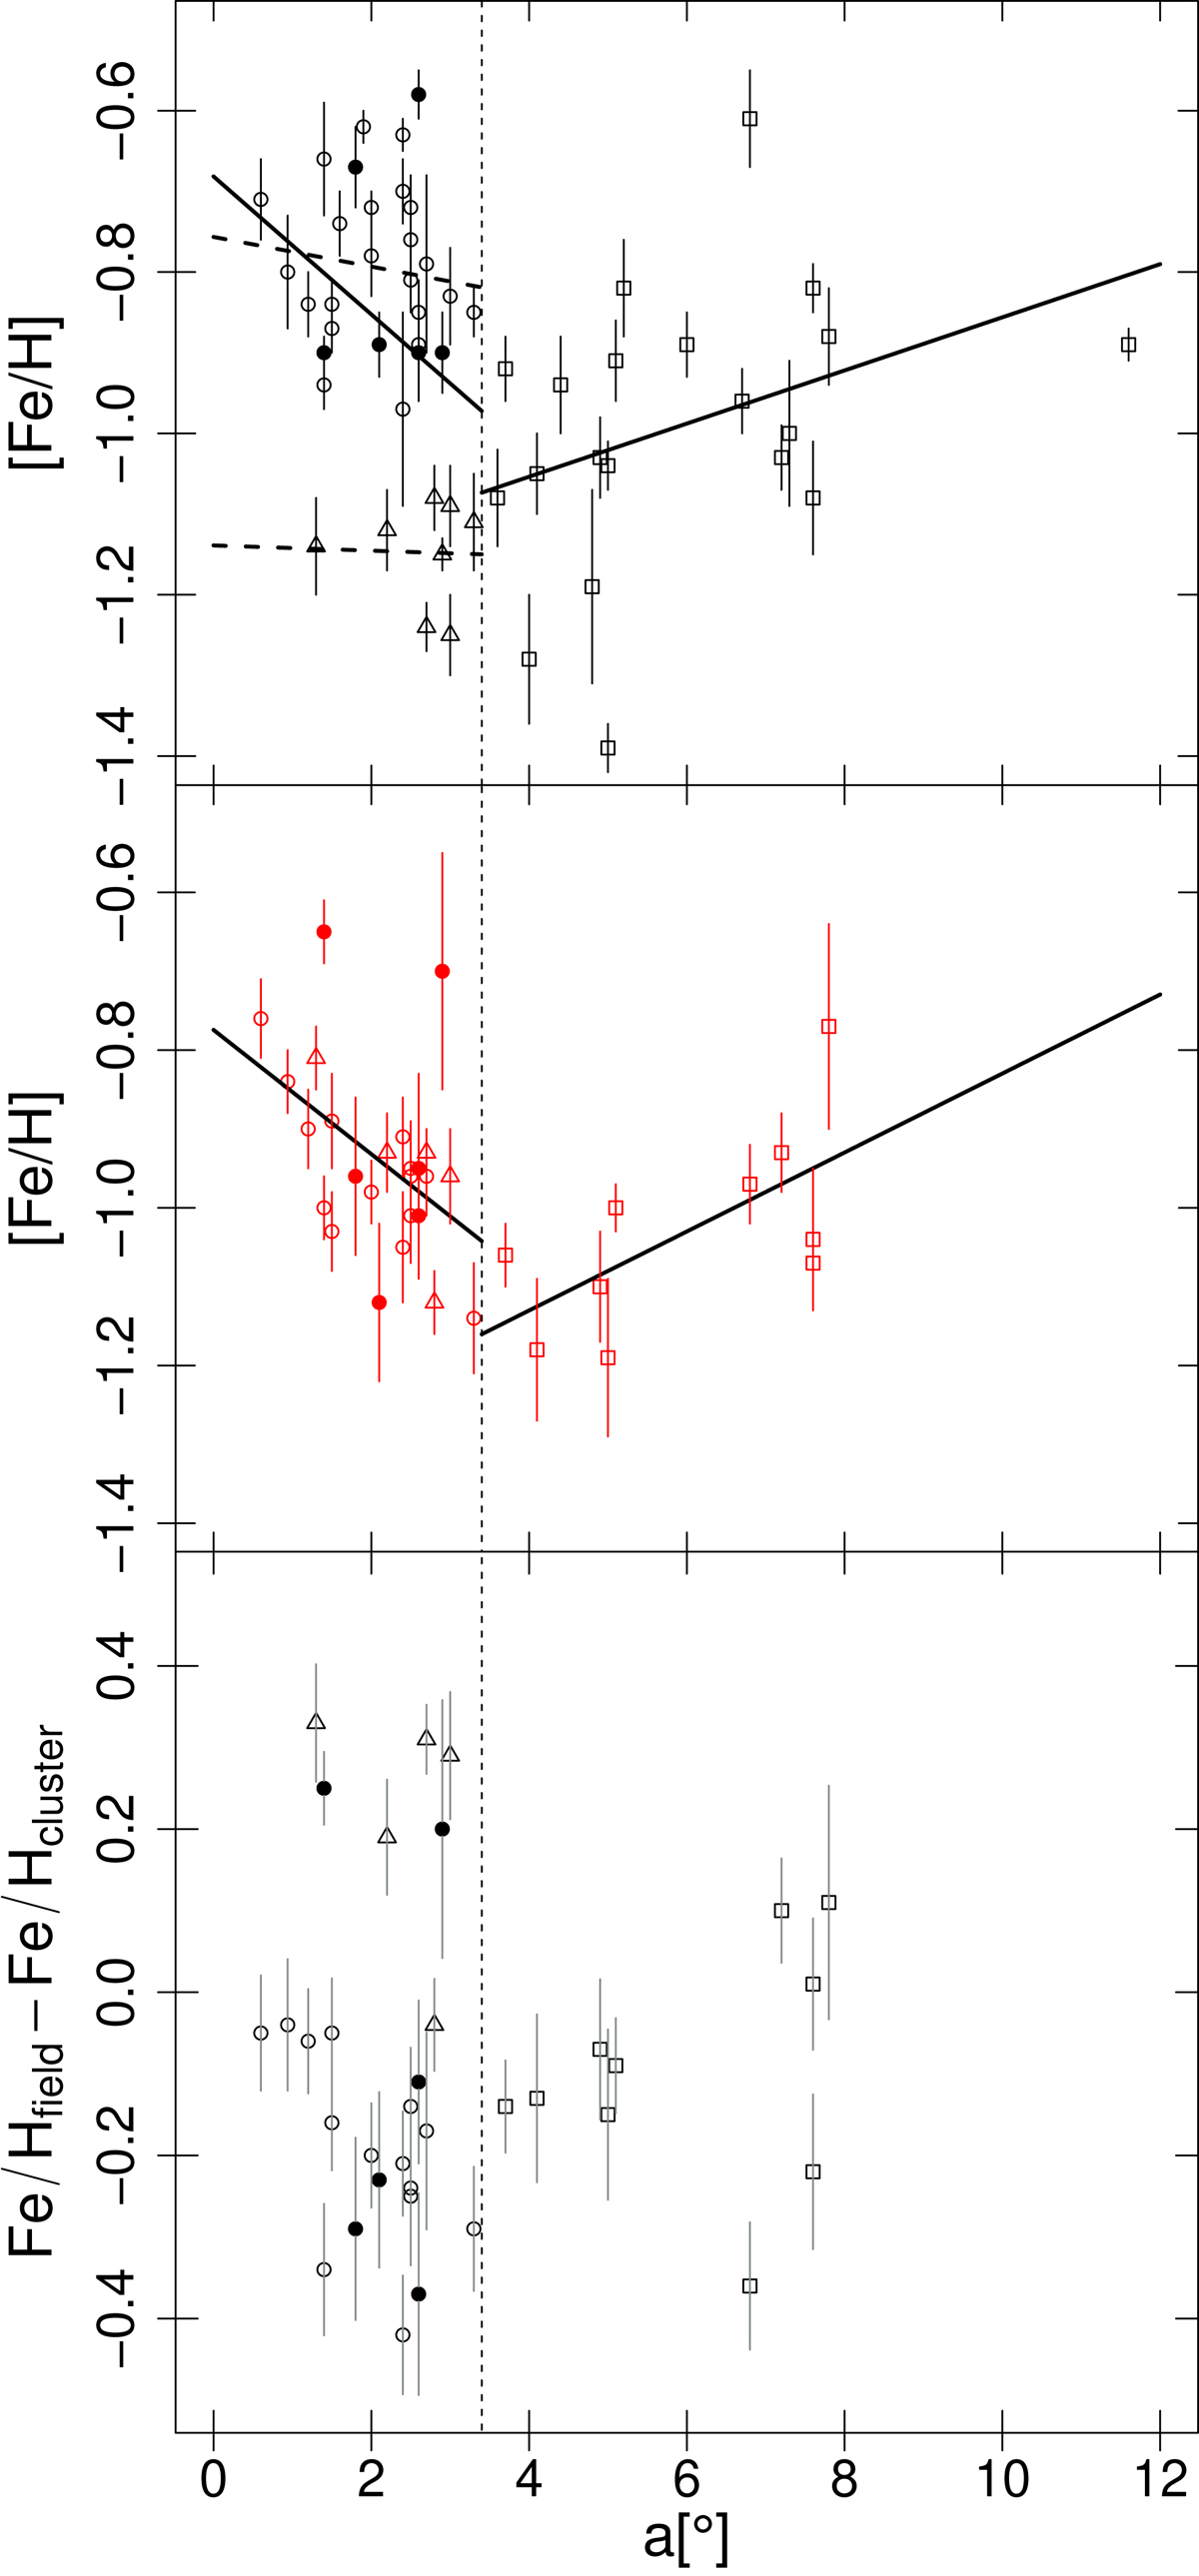
Fig. 11.
Download original image
Metallicity gradient for clusters (upper panel) and field stars (middle panel). Bottom panel: difference between field and cluster metalicities. The filled and open circles are the clusters and fields studied in this work and from the literature, respectively; the circles and triangles show the metal-rich and metal-poor groups in the inner region; the squares show the clusters in the outer region. The vertical line indicates the limit between the inner and outer regions.
Current usage metrics show cumulative count of Article Views (full-text article views including HTML views, PDF and ePub downloads, according to the available data) and Abstracts Views on Vision4Press platform.
Data correspond to usage on the plateform after 2015. The current usage metrics is available 48-96 hours after online publication and is updated daily on week days.
Initial download of the metrics may take a while.