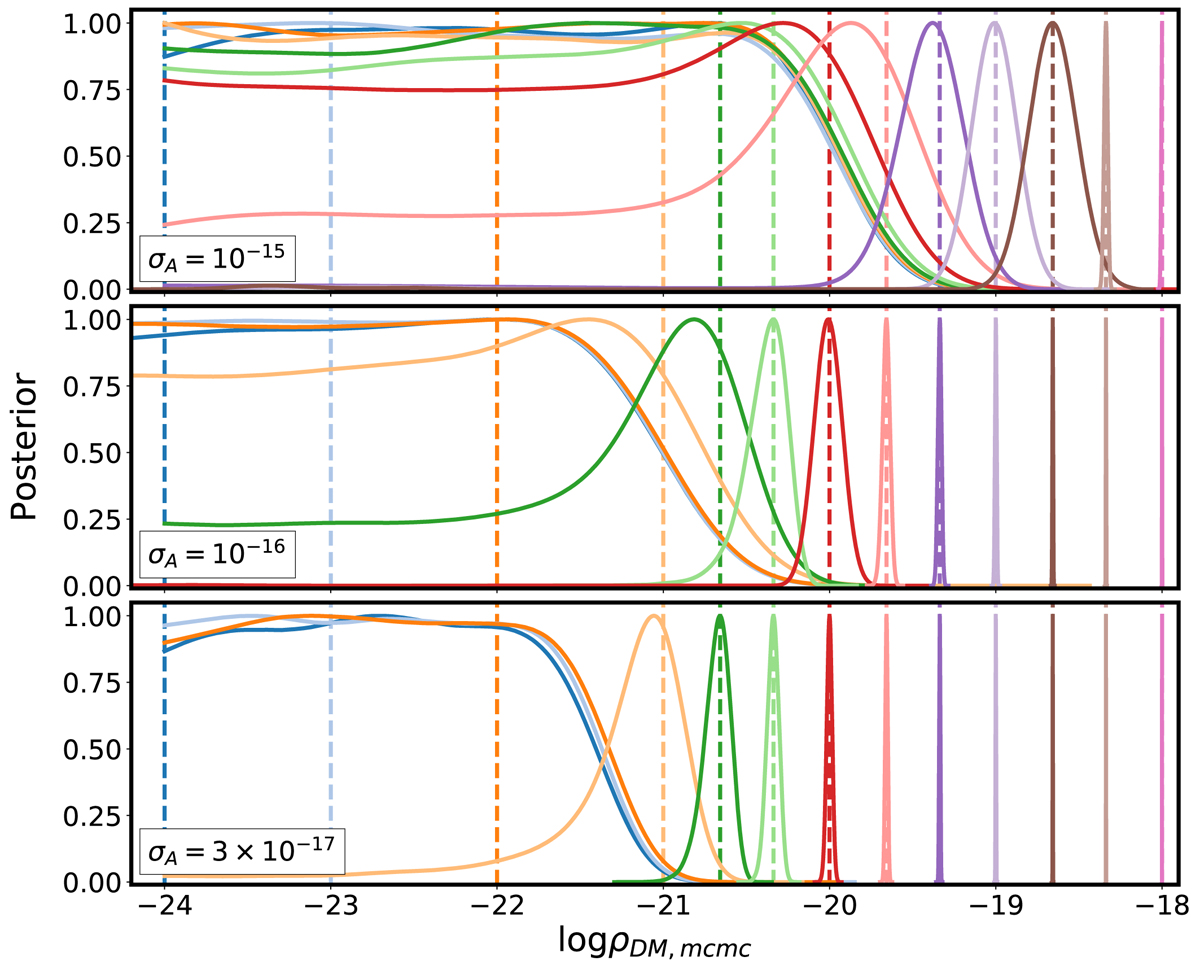
Fig. 4.
Download original image
Posteriors of the DM density for different fiducial values and mission sensitivities. The fiducial values are represented by vertical dashed lines of different colors. The posteriors belonging to the same run share the colours. Note that, for larger DM densities or lower Allan deviations the posteriors smoothly transition from a step function to a Gaussian. Our criterion for producing Eq. (10) is the presence of a clear Gaussian centered on the true value.
Current usage metrics show cumulative count of Article Views (full-text article views including HTML views, PDF and ePub downloads, according to the available data) and Abstracts Views on Vision4Press platform.
Data correspond to usage on the plateform after 2015. The current usage metrics is available 48-96 hours after online publication and is updated daily on week days.
Initial download of the metrics may take a while.