Fig. 2.
Download original image
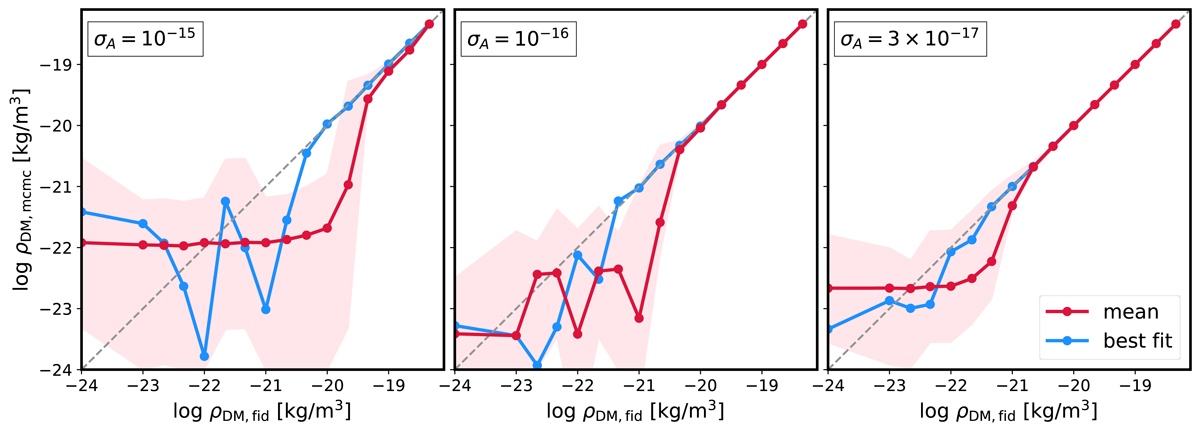
Reconstructed values of DM density as a function of the true density of DM in the solar system, for an improvement of 3 (left), 30 (centre) and 100 (right) times the Cassini-era Allan deviation. The blue lines show the most probable value given by the marginalised posteriors, while the red lines show the mean value. The 1σ uncertainty contour is shown by the shaded area. As expected, missions with an improved Allan deviation are sensitive to smaller quantities of DM. As a criterion for detectability, we check whether both the mean and the most probable posterior values converge on the true DM density. This criterion defines a mission sensitivity, which is approximately given by the scaling ![]() kg m−3.
kg m−3.
Current usage metrics show cumulative count of Article Views (full-text article views including HTML views, PDF and ePub downloads, according to the available data) and Abstracts Views on Vision4Press platform.
Data correspond to usage on the plateform after 2015. The current usage metrics is available 48-96 hours after online publication and is updated daily on week days.
Initial download of the metrics may take a while.