Fig. 1.
Download original image
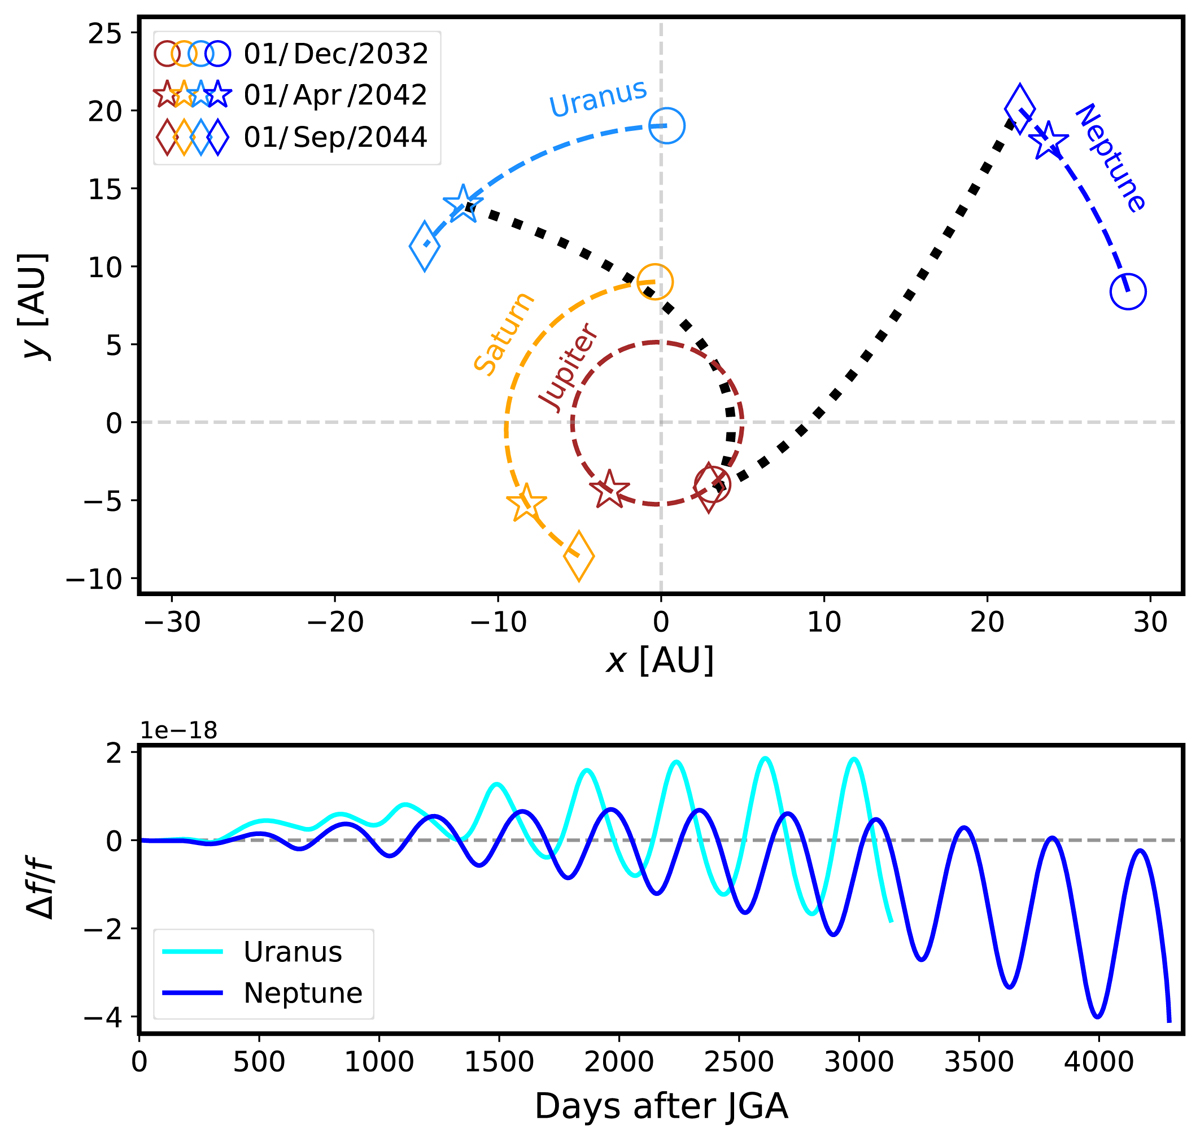
Mission plan and Doppler-tracking signal. Top panel: trajectory of the two spacecraft after the Jupiter swing-by, where different shapes show the positions of the outer planets at various timestamps in the ICRF. The colourful dashed lines show the orbits of the planets and the black dotted lines show the trajectories of the satellites over a period of approximately ten years. The orbits of the planets are taken from the JPL HORIZONS database using the ASTROQUERY tool by Ginsburg et al. (2019), while the spacecraft trajectories are integrated. Bottom panel: noiseless realisation of the change in the two way frequency fluctuation of missions to Uranus and Neptune caused by a constant local dark matter density of 4.6 × 10⁻²² kg m−3. The yearly oscillatory behavior is due to the revolution of the Earth around the Sun.
Current usage metrics show cumulative count of Article Views (full-text article views including HTML views, PDF and ePub downloads, according to the available data) and Abstracts Views on Vision4Press platform.
Data correspond to usage on the plateform after 2015. The current usage metrics is available 48-96 hours after online publication and is updated daily on week days.
Initial download of the metrics may take a while.