Fig. 4.
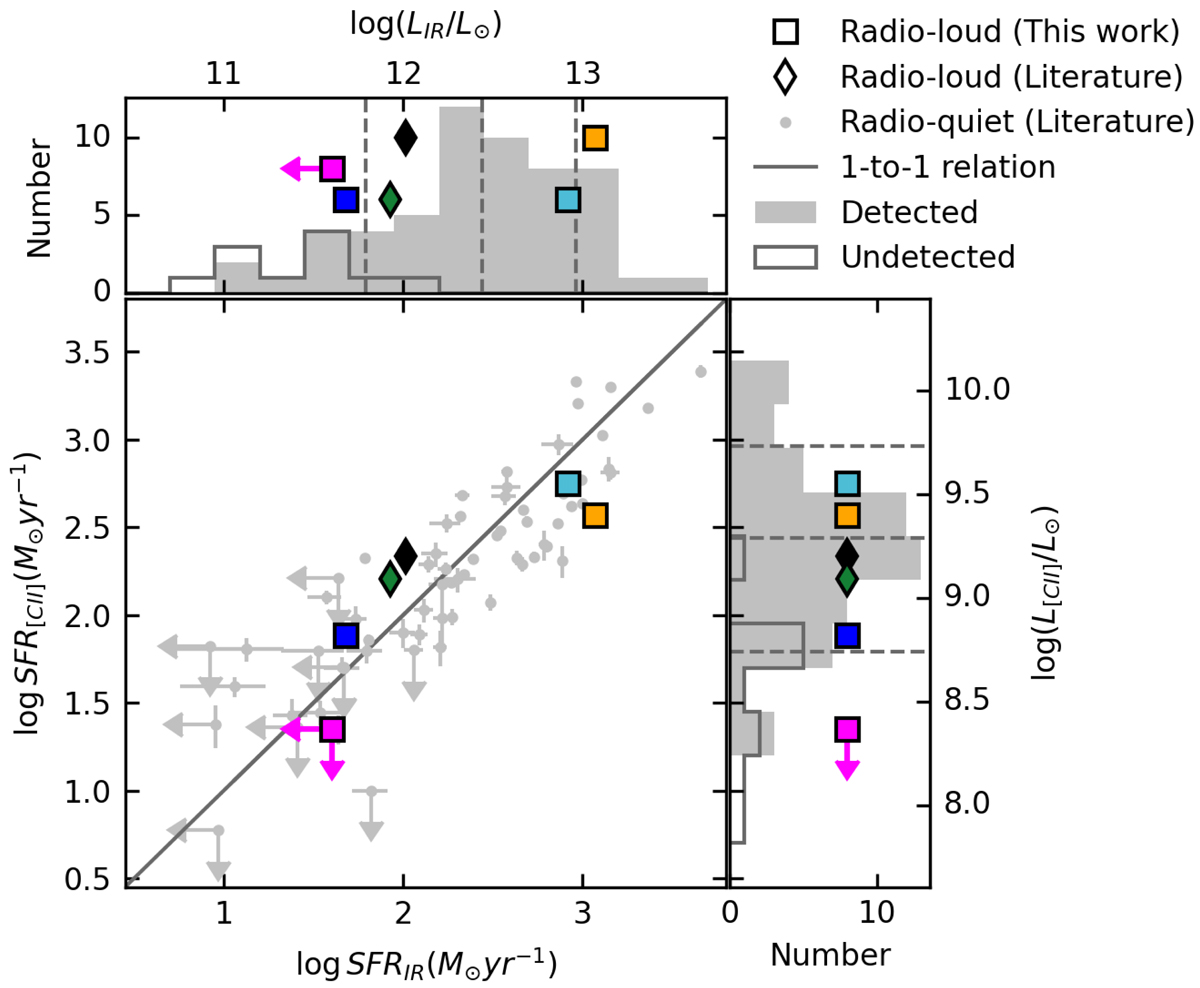
Download original image
SFRs of radio-quiet (grey circles) and radio-loud (colored symbols) quasars at z ≳ 6 using [CII] and IR luminosities as SFR tracers. The radio-loud quasars from our sample are shown as squares and those from the literature are shown as thin diamonds. Colors for radio-loud quasars are the same as in Fig. 2. The solid line shows the one-to-one relation. The SFR (luminosity) distributions of radio-quiet quasars are shown (grey histograms). The dashed lines show the 16th, 50th, and 84th percentiles of the distributions for radio-quiet quasars. References for the literature measurements are in the main text in Sect. 4.2.
Current usage metrics show cumulative count of Article Views (full-text article views including HTML views, PDF and ePub downloads, according to the available data) and Abstracts Views on Vision4Press platform.
Data correspond to usage on the plateform after 2015. The current usage metrics is available 48-96 hours after online publication and is updated daily on week days.
Initial download of the metrics may take a while.