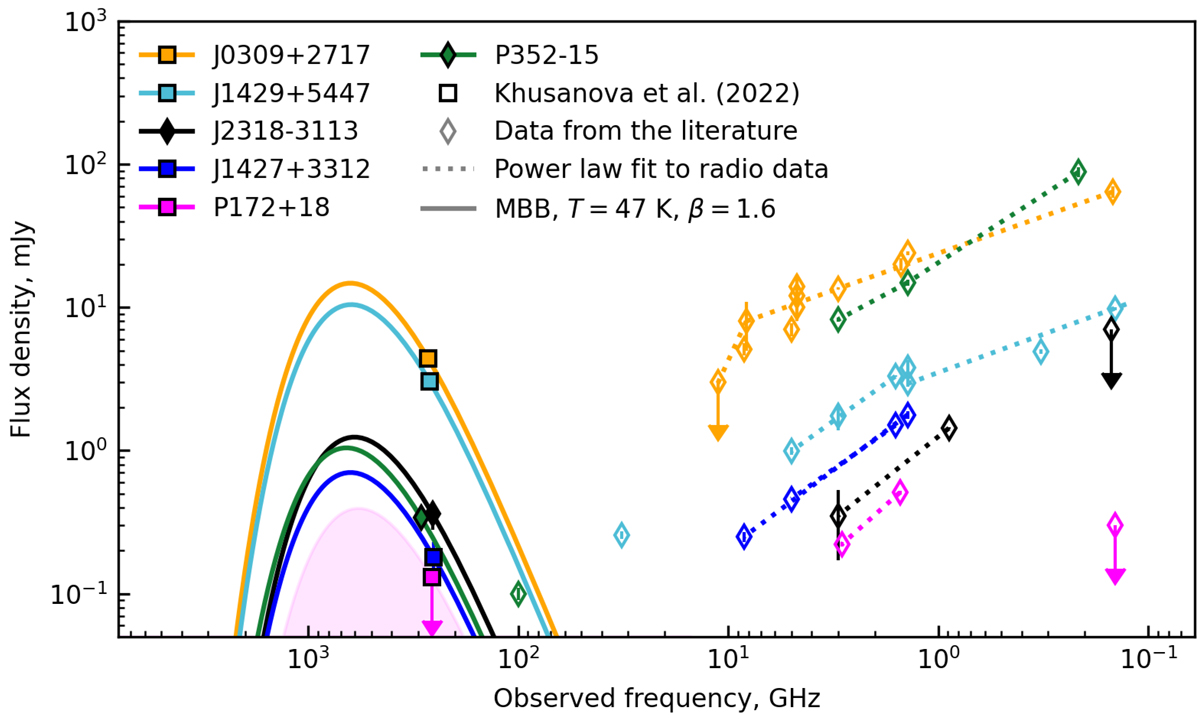
Fig. 2.
Download original image
SEDs of all known radio-loud quasars at z > 6 and P352–15 at z = 5.832. The filled symbols are measurements of the 250 GHz continuum flux density (NOEMA measurements presented in this paper and literature data from ALMA for J2318−3113 Venemans et al. 2020). The solid lines are MBB model (with Tdust = 47 and β = 1.6) scaled to the observed continuum flux density. The dotted lines are the power law (broken power law in the case of J0309+2717 and J1429+5447) fits to the radio data from the literature (Bañados et al. 2021; Condon et al. 1998; Frey et al. 2008, 2011; Ighina et al. 2021a; Intema et al. 2017; Momjian et al. 2008; Shimwell et al. 2019; Wang et al. 2011). The literature data are shown with thin diamonds and the NOEMA data for our sample with squares. Different colors correspond to each of the radio-loud quasars as indicated in the legend. The shaded area shows the region below the 3σ limit for continuum flux density of P172+18, which is not detected with NOEMA.
Current usage metrics show cumulative count of Article Views (full-text article views including HTML views, PDF and ePub downloads, according to the available data) and Abstracts Views on Vision4Press platform.
Data correspond to usage on the plateform after 2015. The current usage metrics is available 48-96 hours after online publication and is updated daily on week days.
Initial download of the metrics may take a while.