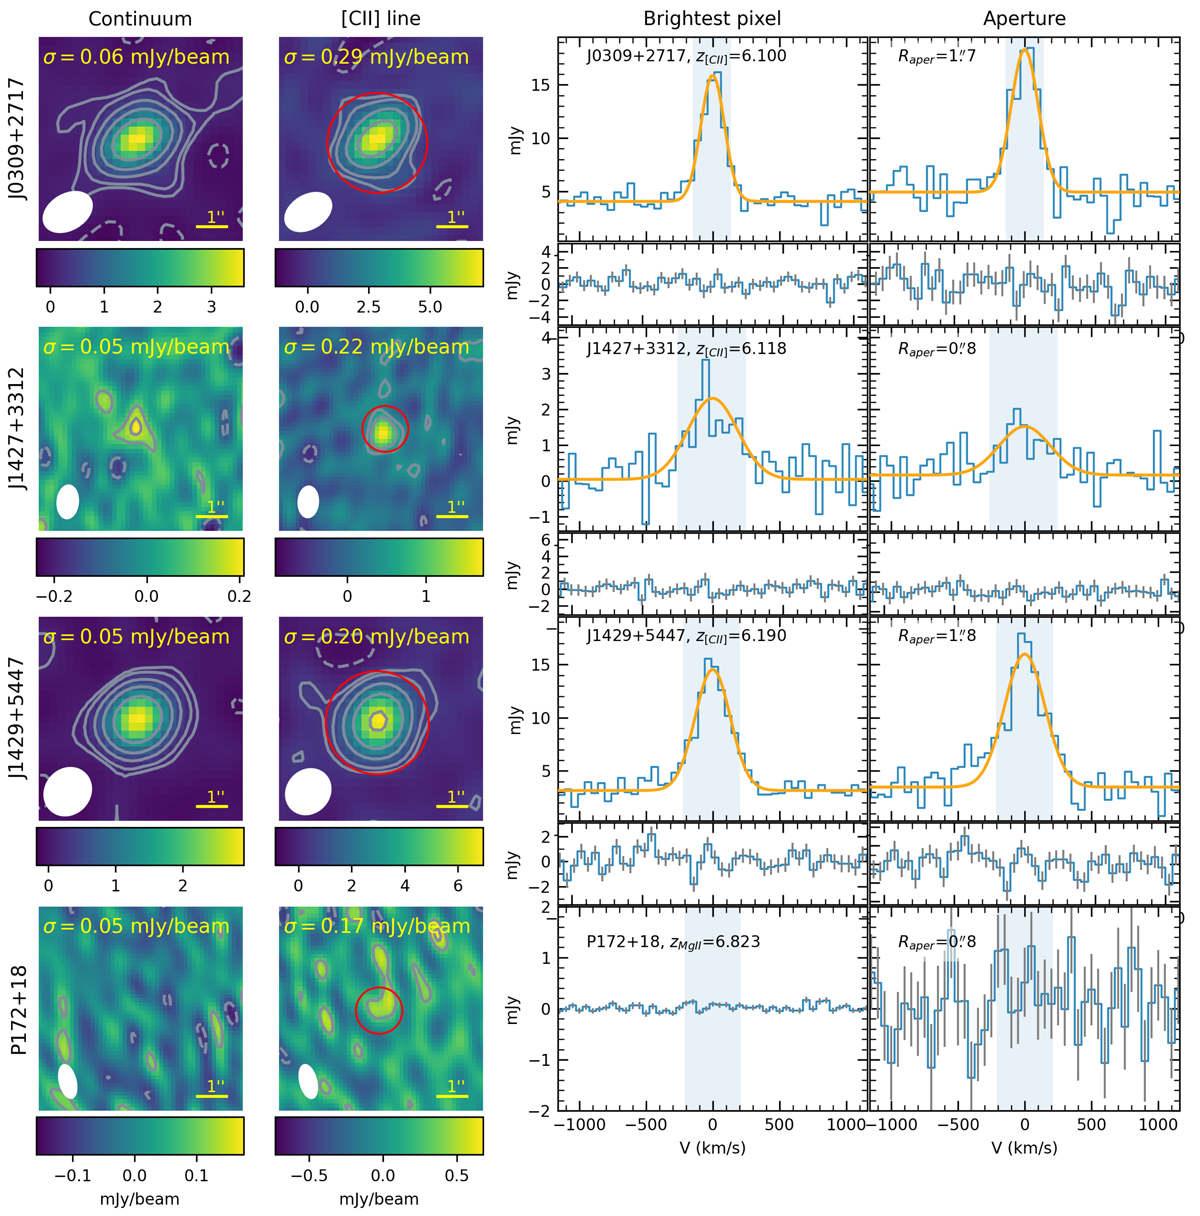
Fig. 1.
Download original image
Images and spectra of the radio-loud quasars in our sample. First column: the 250 GHz continuum images. The contour levels are (−2, 2, 3.5, 8, 16, 32)×σ. Second column: the integrated [CII] line images (continuum subtracted). The contour levels are (−2, 2, 3.5, 8, 16, 32)×σ and σ values are shown on the images. The contour levels are the same as in the first column. The red circles show the apertures from which the spectrum in the fourth column was extracted. Third column: spectra from the brightest (central) pixel. The solid orange line shows the best fit to the line with a Gaussian. The shaded area shows the channels used to create the integrated maps in the second column. Fourth column: spectra extracted using the apertures shown in images in the second column (see Sect. 2).
Current usage metrics show cumulative count of Article Views (full-text article views including HTML views, PDF and ePub downloads, according to the available data) and Abstracts Views on Vision4Press platform.
Data correspond to usage on the plateform after 2015. The current usage metrics is available 48-96 hours after online publication and is updated daily on week days.
Initial download of the metrics may take a while.