Open Access
Fig. 5.
Download original image
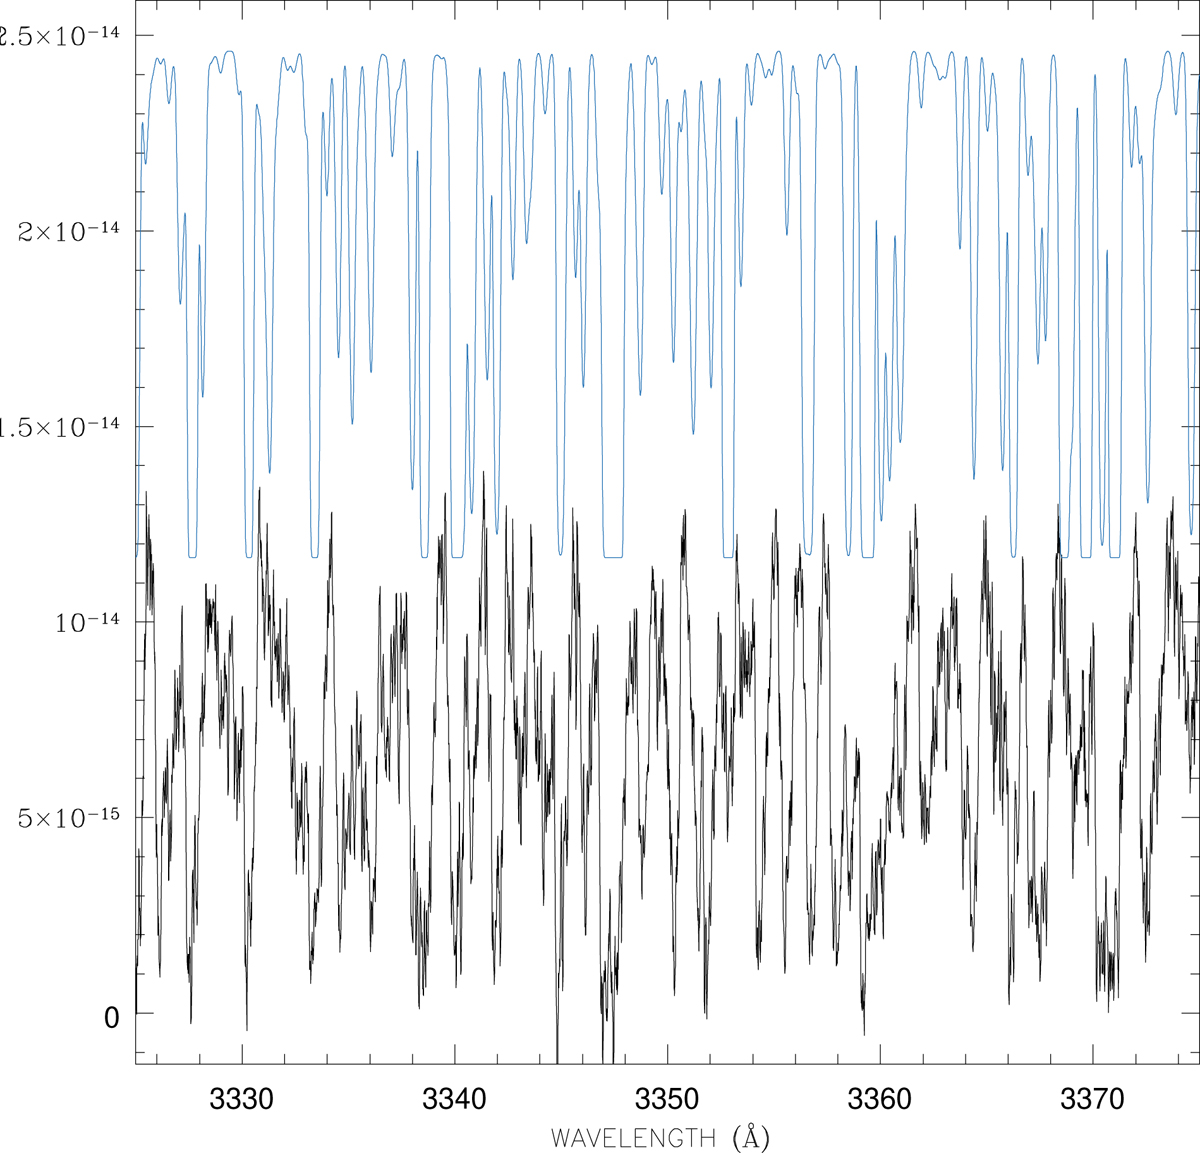
Comparison between the observations (black line, epoch 1 spectrum, smoothed with a running box of 5) and the curtain simulation produced as described in the text (light blue line). Units of the y axis are erg s−1 cm−2 Å−1. The simulation has been arbitrarily scaled.
Current usage metrics show cumulative count of Article Views (full-text article views including HTML views, PDF and ePub downloads, according to the available data) and Abstracts Views on Vision4Press platform.
Data correspond to usage on the plateform after 2015. The current usage metrics is available 48-96 hours after online publication and is updated daily on week days.
Initial download of the metrics may take a while.