Fig. 5.
Download original image
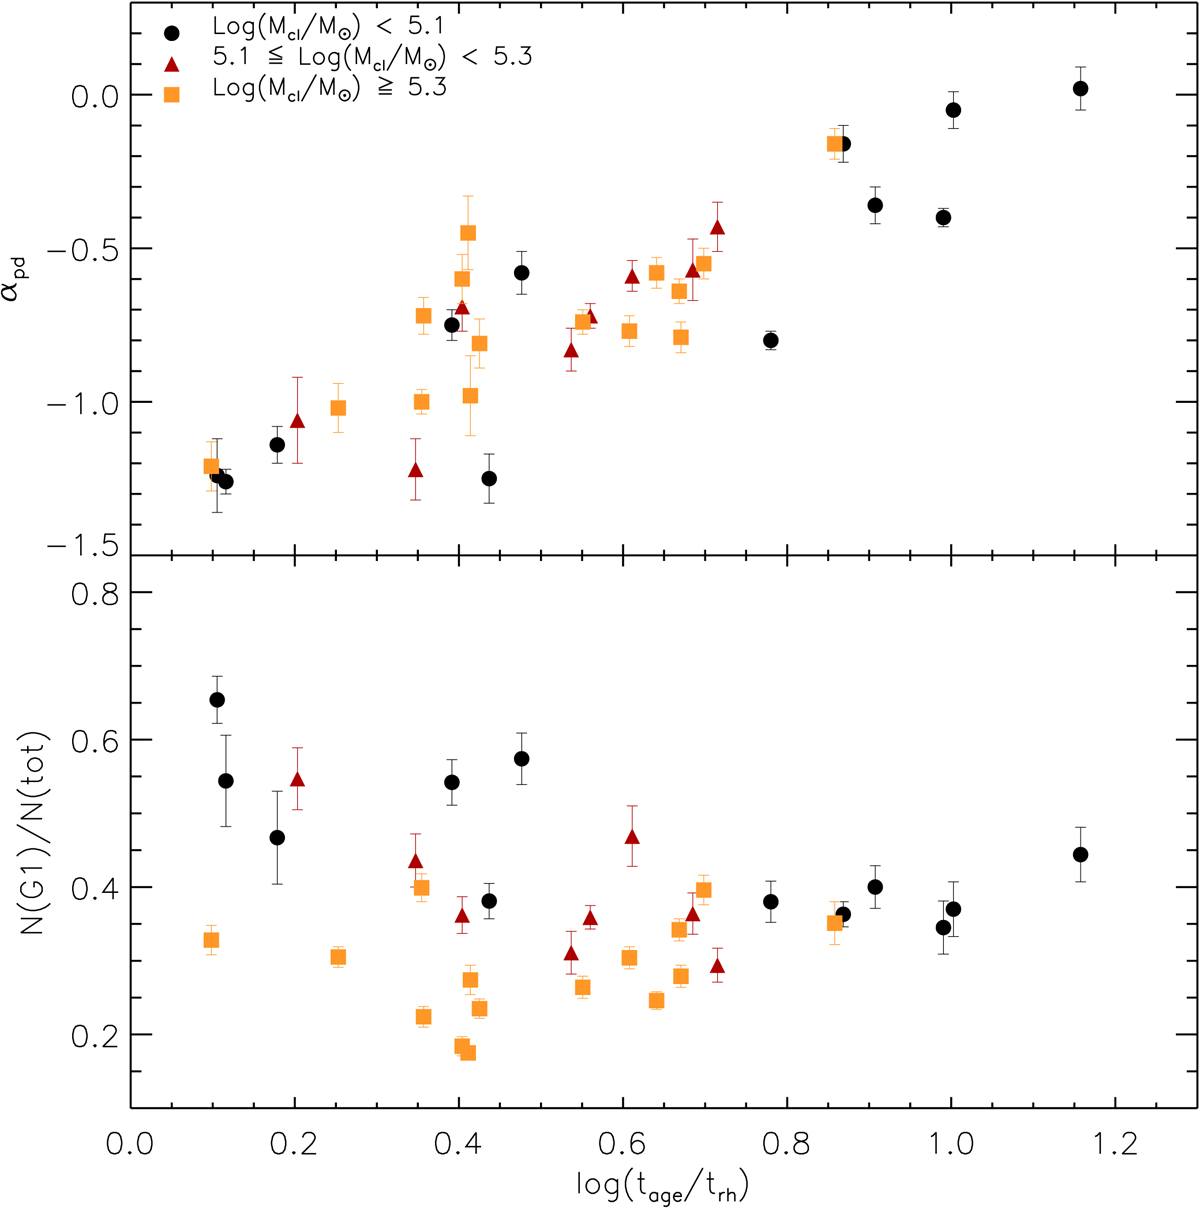
Value of the present-day slope of the stellar mass function (αpd) plotted as a function of the ratio (log(tage/trh)), where tage are the ages of the clusters and the th their present-day half-mass relaxation time (upper subpanel) and fraction of G1 stars in the clusters plotted as a function of log(tage/trh) (lower subpanel). In both subpanels, clusters are segregated by their mass, which is taken to be the mean value of the photometric and dynamical masses.
Current usage metrics show cumulative count of Article Views (full-text article views including HTML views, PDF and ePub downloads, according to the available data) and Abstracts Views on Vision4Press platform.
Data correspond to usage on the plateform after 2015. The current usage metrics is available 48-96 hours after online publication and is updated daily on week days.
Initial download of the metrics may take a while.