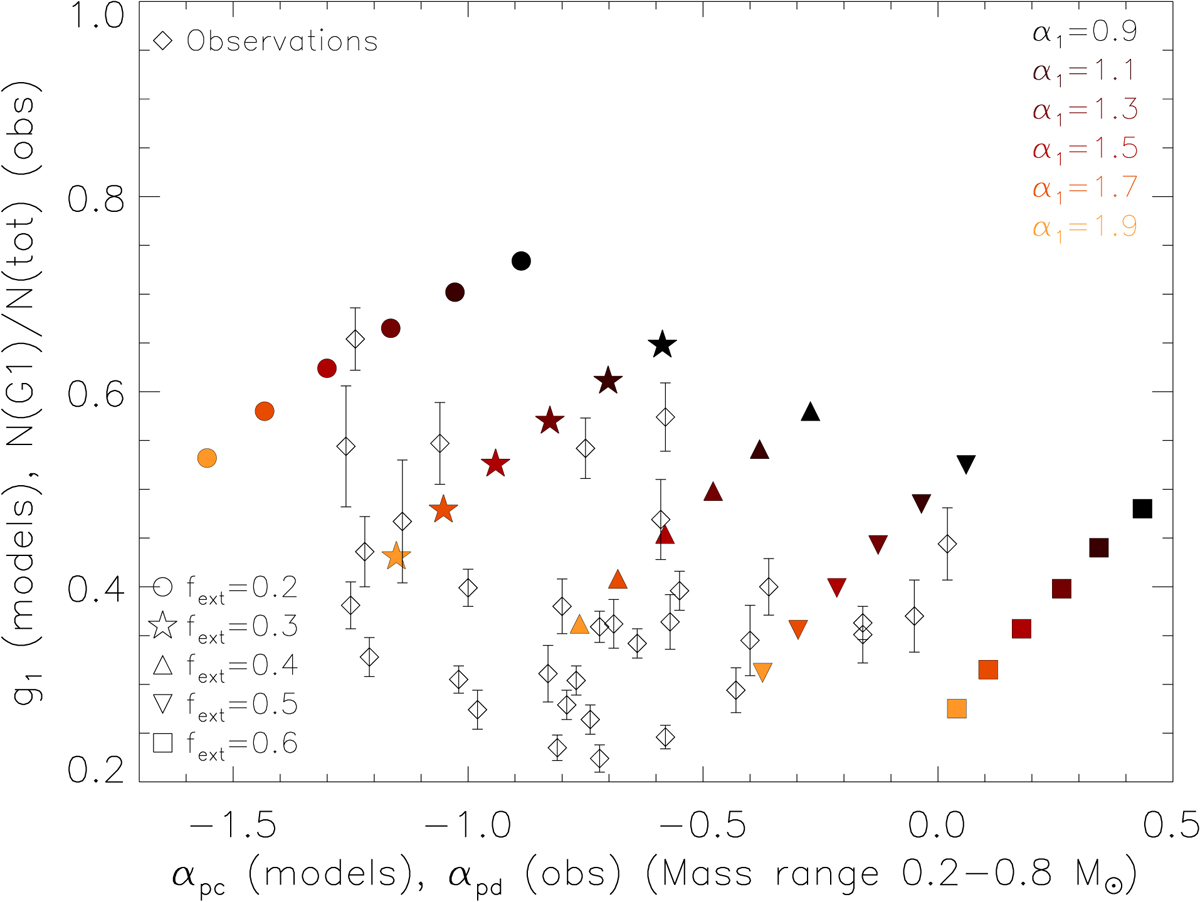
Fig. 4.
Download original image
Relationship between g1 and the slope of the post-collision mass function, αpc (for stars in the mass range 0.2–0.8 M⊙), for various shapes of the IMF, namely for various values of the slope in the intermediate-mass range, α1, and for various values of fext. In all models, the values of α0 and α2 are fixed to −0.3 and −2.3, respectively. The models are compared to the (N(G1)/N(tot)) − αpd found in the observations.
Current usage metrics show cumulative count of Article Views (full-text article views including HTML views, PDF and ePub downloads, according to the available data) and Abstracts Views on Vision4Press platform.
Data correspond to usage on the plateform after 2015. The current usage metrics is available 48-96 hours after online publication and is updated daily on week days.
Initial download of the metrics may take a while.