Fig. 5
Download original image
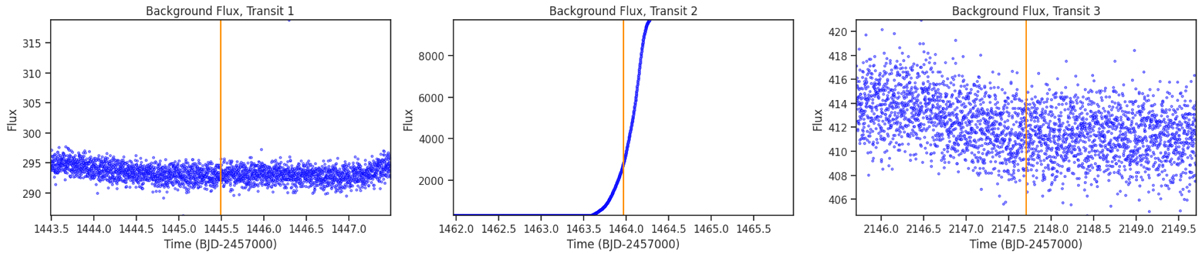
Background flux around the single transits for the detected signal in TIC 369394241 Sector 5. The transits’ position are indicated by orange vertical lines. Left and right panels show low and constant values of background flux for the first and third transits. Centre panel shows a steep increase of background flux half a day before the second transit, reaching values 20 times higher than the baseline found for the other transits.
Current usage metrics show cumulative count of Article Views (full-text article views including HTML views, PDF and ePub downloads, according to the available data) and Abstracts Views on Vision4Press platform.
Data correspond to usage on the plateform after 2015. The current usage metrics is available 48-96 hours after online publication and is updated daily on week days.
Initial download of the metrics may take a while.