Fig. 3
Download original image
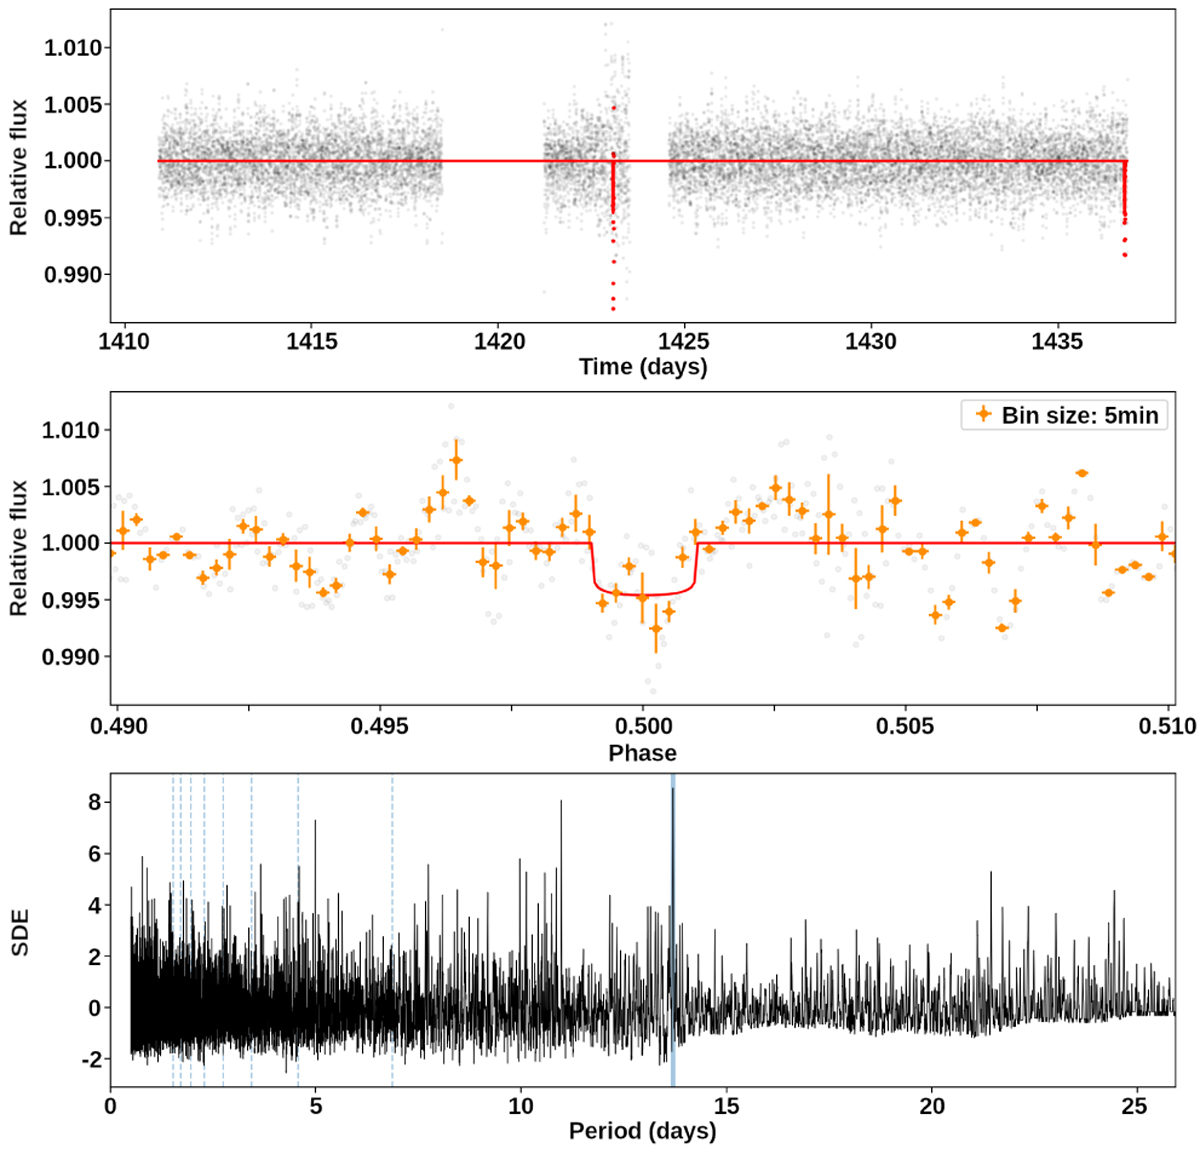
Example of a signal in the light curve of TIC 64111698 with both S/N and SDE above our thresholds. The light curve was still ruled out during our visual inspection. The position of the two detected transits is suspicious (top panel): the first transit occurs is in a high-noise region, and the second transit is at the edge of a dataset, where typically more trends exist. The phase-folded light curve (middle panel) shows strong variability out of transit with a similar amplitude as the transit signal. Finally, the signal has no harmonics and does not significantly rise above the noise (bottom panel). All these hints suggest that the spotted signal is most likely a false positive.
Current usage metrics show cumulative count of Article Views (full-text article views including HTML views, PDF and ePub downloads, according to the available data) and Abstracts Views on Vision4Press platform.
Data correspond to usage on the plateform after 2015. The current usage metrics is available 48-96 hours after online publication and is updated daily on week days.
Initial download of the metrics may take a while.