Fig. 1
Download original image
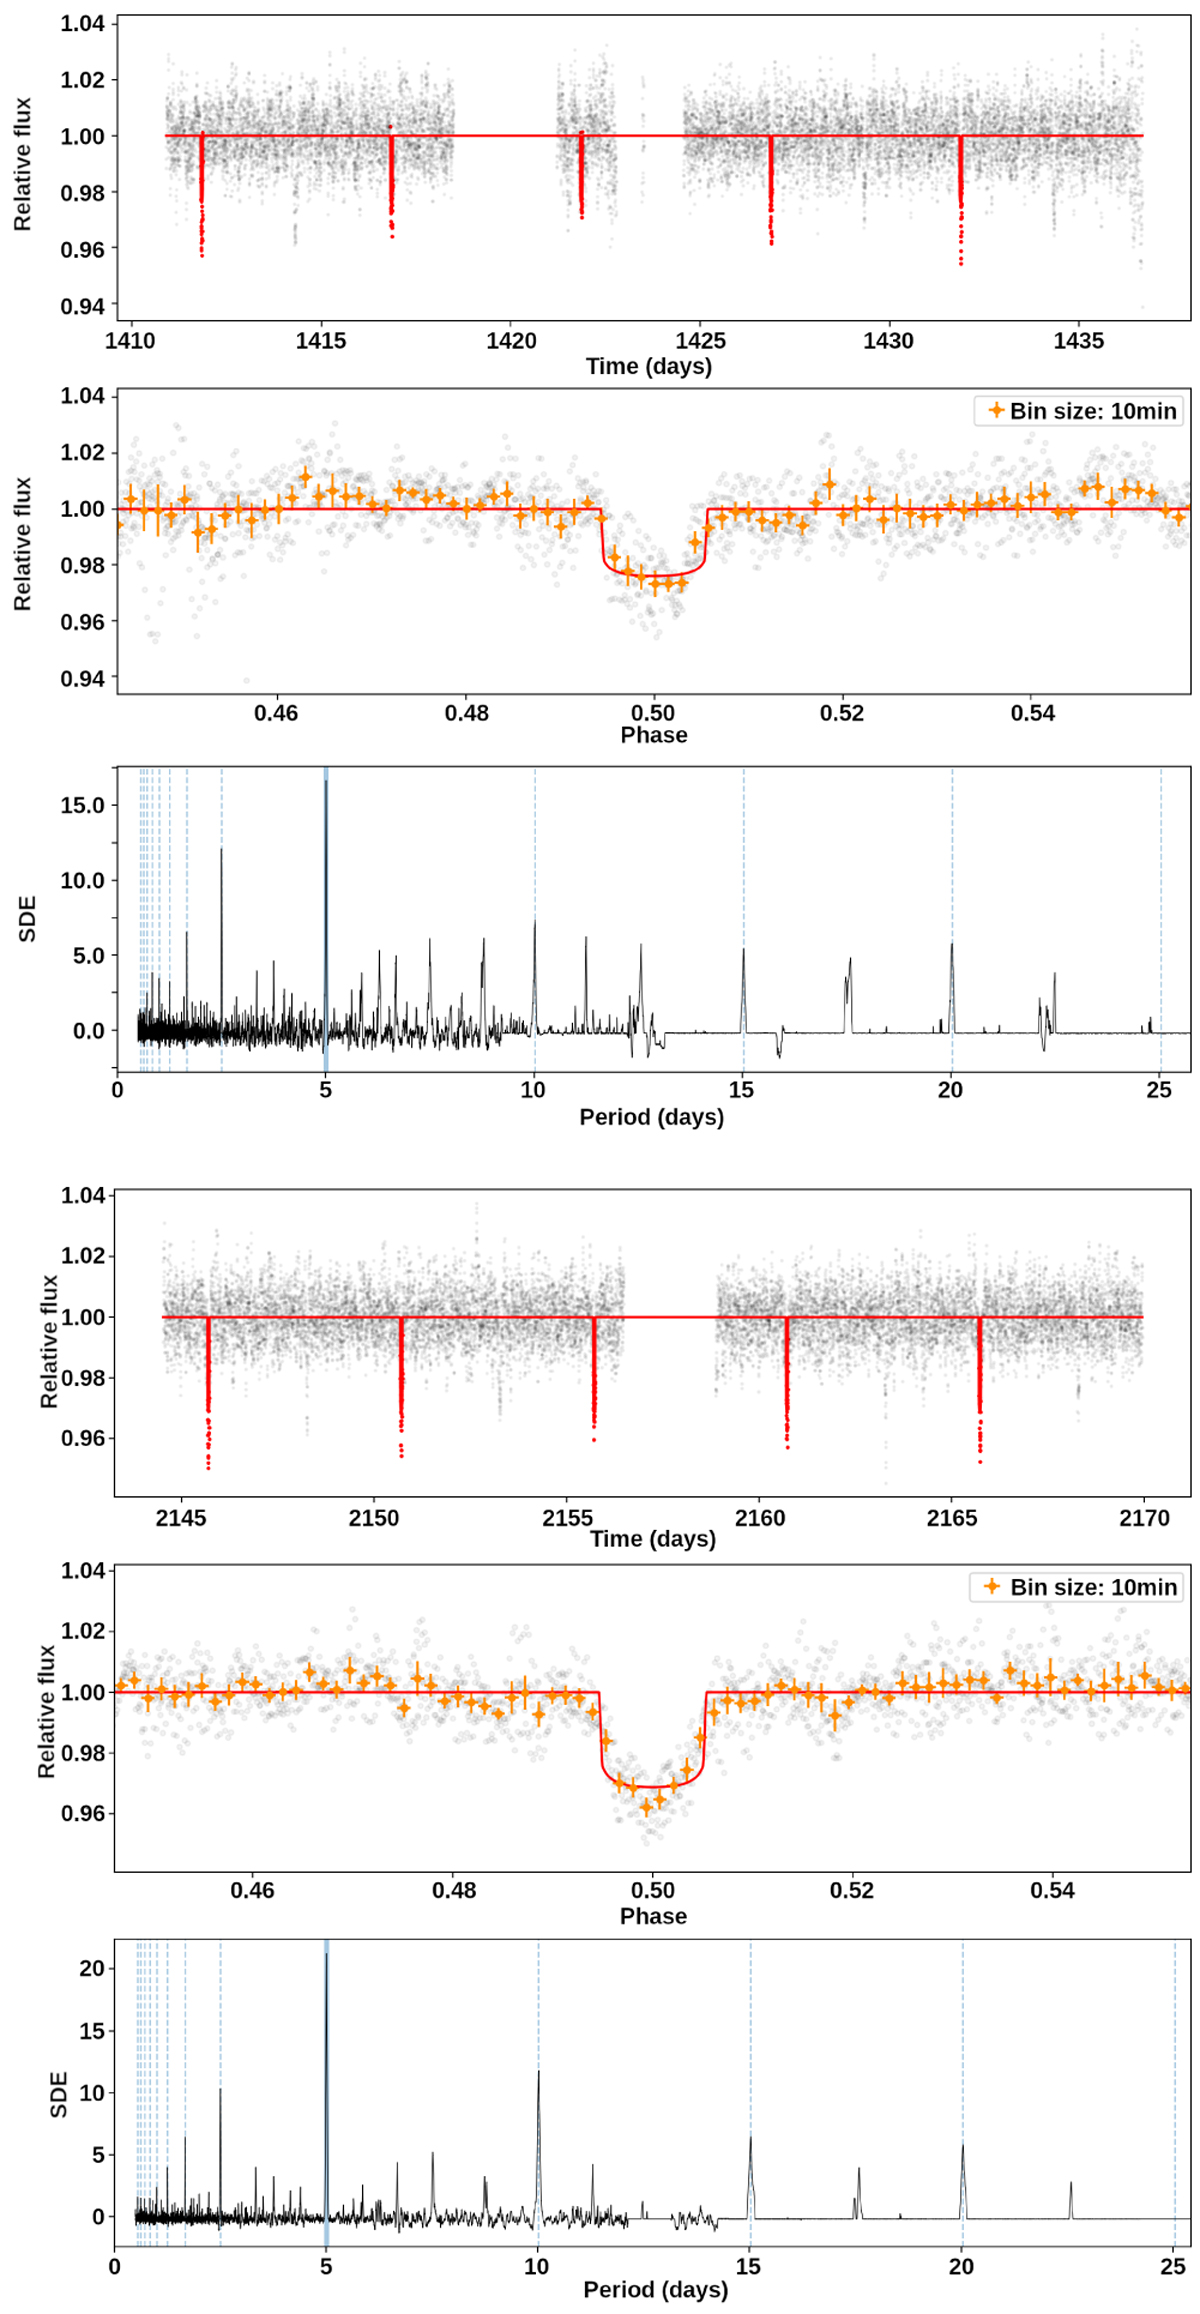
SHERLOCK output of the best result of the first run of TIC 142875987 in sectors 4 (panels 1 to 3, from top to bottom) and 31 (panels 4 to 6) of TESS. The secondary eclipse is clearly visible in the top panel of both sectors (panels 1 and 4) where the detrended light curve (grey) and position of the detected transits (red) are shown. Panels 2 and 5: phase-folded light curve over the period of the spotted transit. Panels 3 and 6: power spectrum with the main signal and its harmonics highlighted.
Current usage metrics show cumulative count of Article Views (full-text article views including HTML views, PDF and ePub downloads, according to the available data) and Abstracts Views on Vision4Press platform.
Data correspond to usage on the plateform after 2015. The current usage metrics is available 48-96 hours after online publication and is updated daily on week days.
Initial download of the metrics may take a while.