Fig. 5.
Download original image
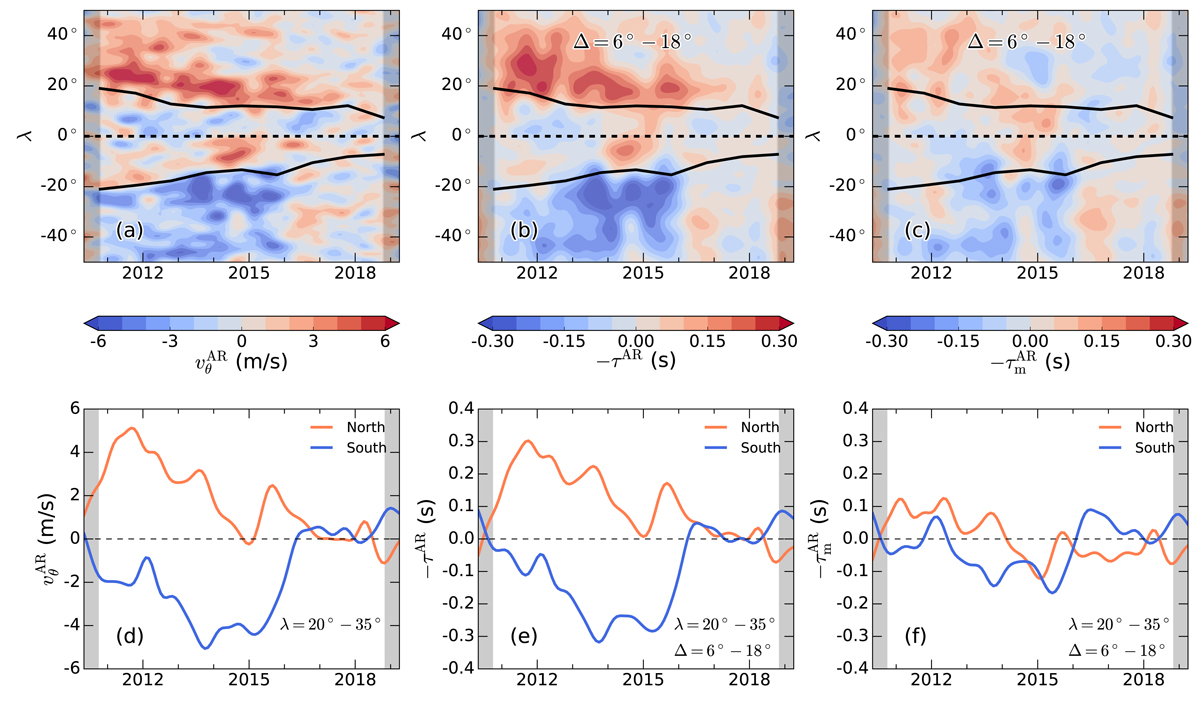
Active-region flows and associated forward travel-time perturbations as a function of time and latitude. Panel a: longitudinally averaged active-region flows ![]() as plotted in Fig. 2, shown again here for convenience of comparison. Panel b: longitudinally averaged forward travel-time perturbations −τAR, farther averaged over the separation distances 6°–18°. Panel c: same as panel b, but for the travel-time perturbations with the magnetic mask applied,
as plotted in Fig. 2, shown again here for convenience of comparison. Panel b: longitudinally averaged forward travel-time perturbations −τAR, farther averaged over the separation distances 6°–18°. Panel c: same as panel b, but for the travel-time perturbations with the magnetic mask applied, ![]() (discussed in Sect. 4.2). We applied the same smoothing as in Fig. 2. The black lines show the mean active latitudes. Panels d–f: averages of the top panels over the latitudes λ = 20° −35° in each hemisphere. The typical errors in the flows over the latitudinal range of interest are about 0.6 m s−1. For the travel-time perturbations, the errors are in the range of 0.002–0.008 s, with the largest error for
(discussed in Sect. 4.2). We applied the same smoothing as in Fig. 2. The black lines show the mean active latitudes. Panels d–f: averages of the top panels over the latitudes λ = 20° −35° in each hemisphere. The typical errors in the flows over the latitudinal range of interest are about 0.6 m s−1. For the travel-time perturbations, the errors are in the range of 0.002–0.008 s, with the largest error for ![]() during the peaks of activity. The errors are not shown here. In all panels, the shaded areas indicate the times when the edge effects become visible due to the one-year temporal smoothing of the background flows.
during the peaks of activity. The errors are not shown here. In all panels, the shaded areas indicate the times when the edge effects become visible due to the one-year temporal smoothing of the background flows.
Current usage metrics show cumulative count of Article Views (full-text article views including HTML views, PDF and ePub downloads, according to the available data) and Abstracts Views on Vision4Press platform.
Data correspond to usage on the plateform after 2015. The current usage metrics is available 48-96 hours after online publication and is updated daily on week days.
Initial download of the metrics may take a while.