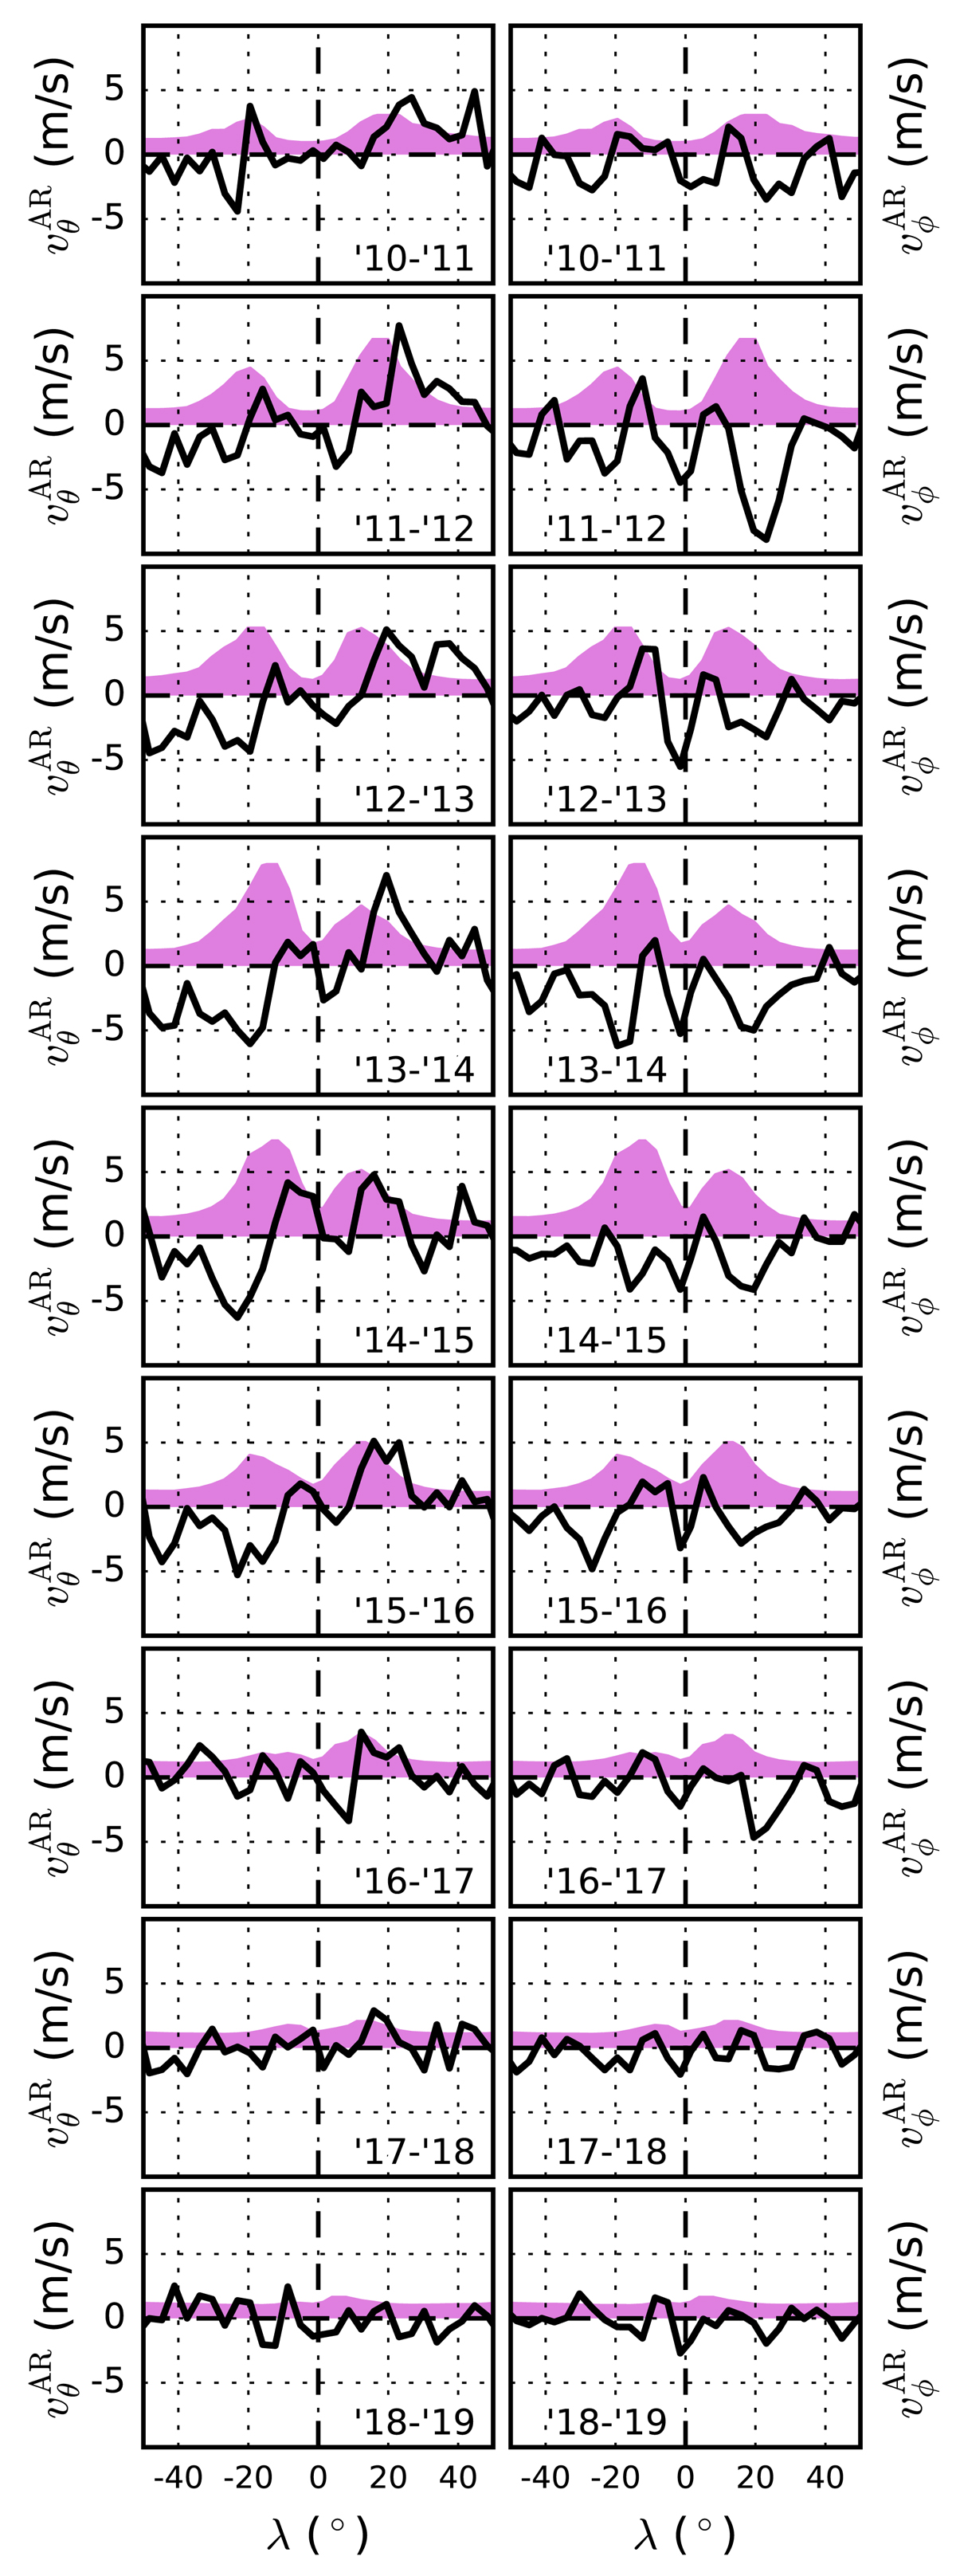
Fig. 3.
Download original image
Longitudinally and yearly averaged ![]() and
and ![]() (black lines), binned every 3.6° in latitude. The standard error of the mean in each binning interval is about 1 m s−1 for
(black lines), binned every 3.6° in latitude. The standard error of the mean in each binning interval is about 1 m s−1 for ![]() and 0.4 m s−1 for
and 0.4 m s−1 for ![]() , and is not shown here. The magenta filling indicates the distribution of |Br| (normalized to the same arbitrary constant in all time periods), which was averaged and binned in the same way as the flows.
, and is not shown here. The magenta filling indicates the distribution of |Br| (normalized to the same arbitrary constant in all time periods), which was averaged and binned in the same way as the flows.
Current usage metrics show cumulative count of Article Views (full-text article views including HTML views, PDF and ePub downloads, according to the available data) and Abstracts Views on Vision4Press platform.
Data correspond to usage on the plateform after 2015. The current usage metrics is available 48-96 hours after online publication and is updated daily on week days.
Initial download of the metrics may take a while.