Fig. 2.
Download original image
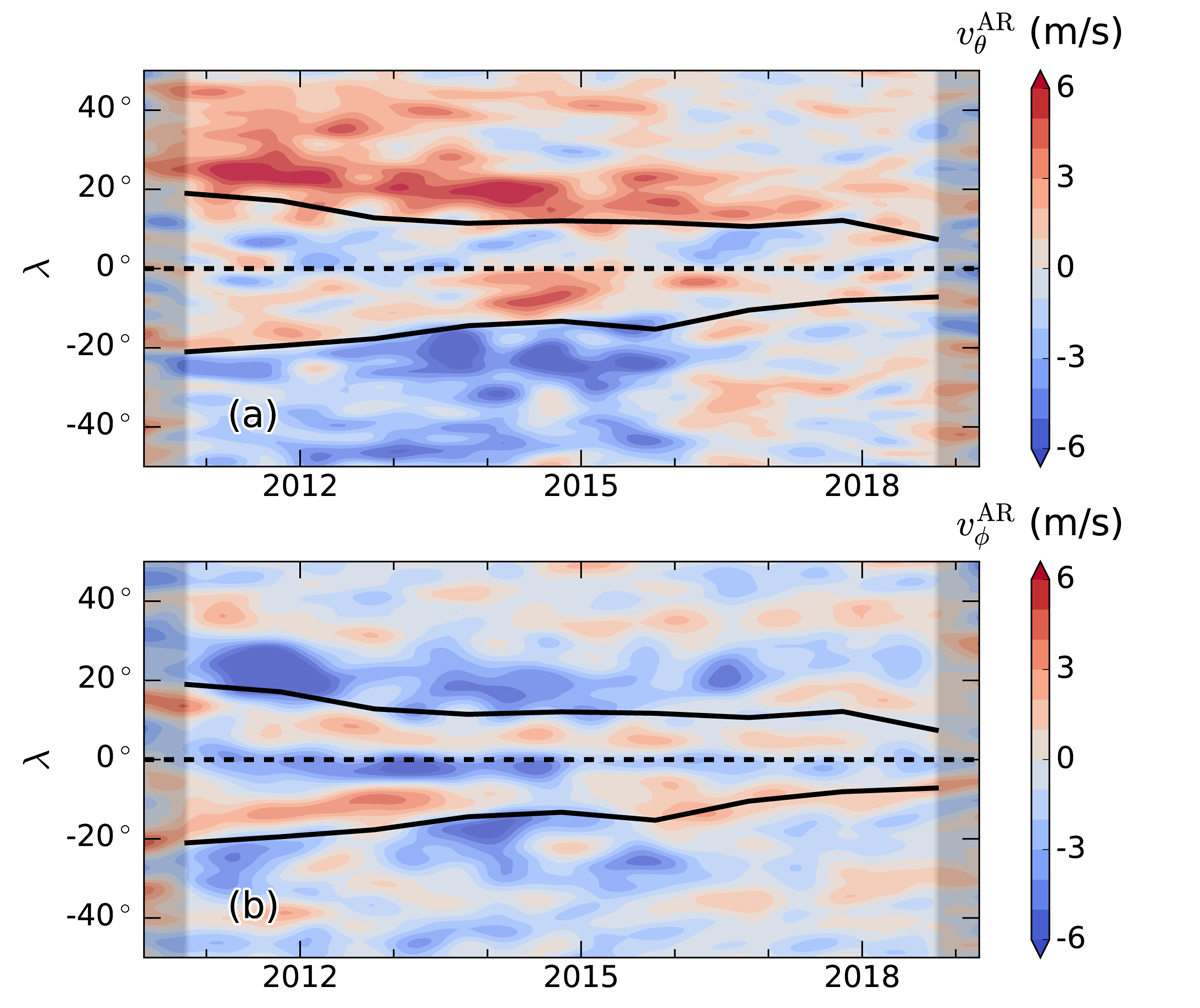
Longitudinal average of ![]() (panel a; positive values are southward) and
(panel a; positive values are southward) and ![]() (panel b; positive values are prograde), as a function of time and latitude. They were farther smoothed in latitude with a Gaussian of FWHM of 3.6° and in time with a Gaussian of FWHM of 6 months. The black lines show the mean active latitudes. The ticks on the horizontal axis indicate the beginning of each year. The shaded areas indicate the times when the edge effects become visible due to the one-year temporal smoothing of the background flows.
(panel b; positive values are prograde), as a function of time and latitude. They were farther smoothed in latitude with a Gaussian of FWHM of 3.6° and in time with a Gaussian of FWHM of 6 months. The black lines show the mean active latitudes. The ticks on the horizontal axis indicate the beginning of each year. The shaded areas indicate the times when the edge effects become visible due to the one-year temporal smoothing of the background flows.
Current usage metrics show cumulative count of Article Views (full-text article views including HTML views, PDF and ePub downloads, according to the available data) and Abstracts Views on Vision4Press platform.
Data correspond to usage on the plateform after 2015. The current usage metrics is available 48-96 hours after online publication and is updated daily on week days.
Initial download of the metrics may take a while.