Fig. D.1.
Download original image
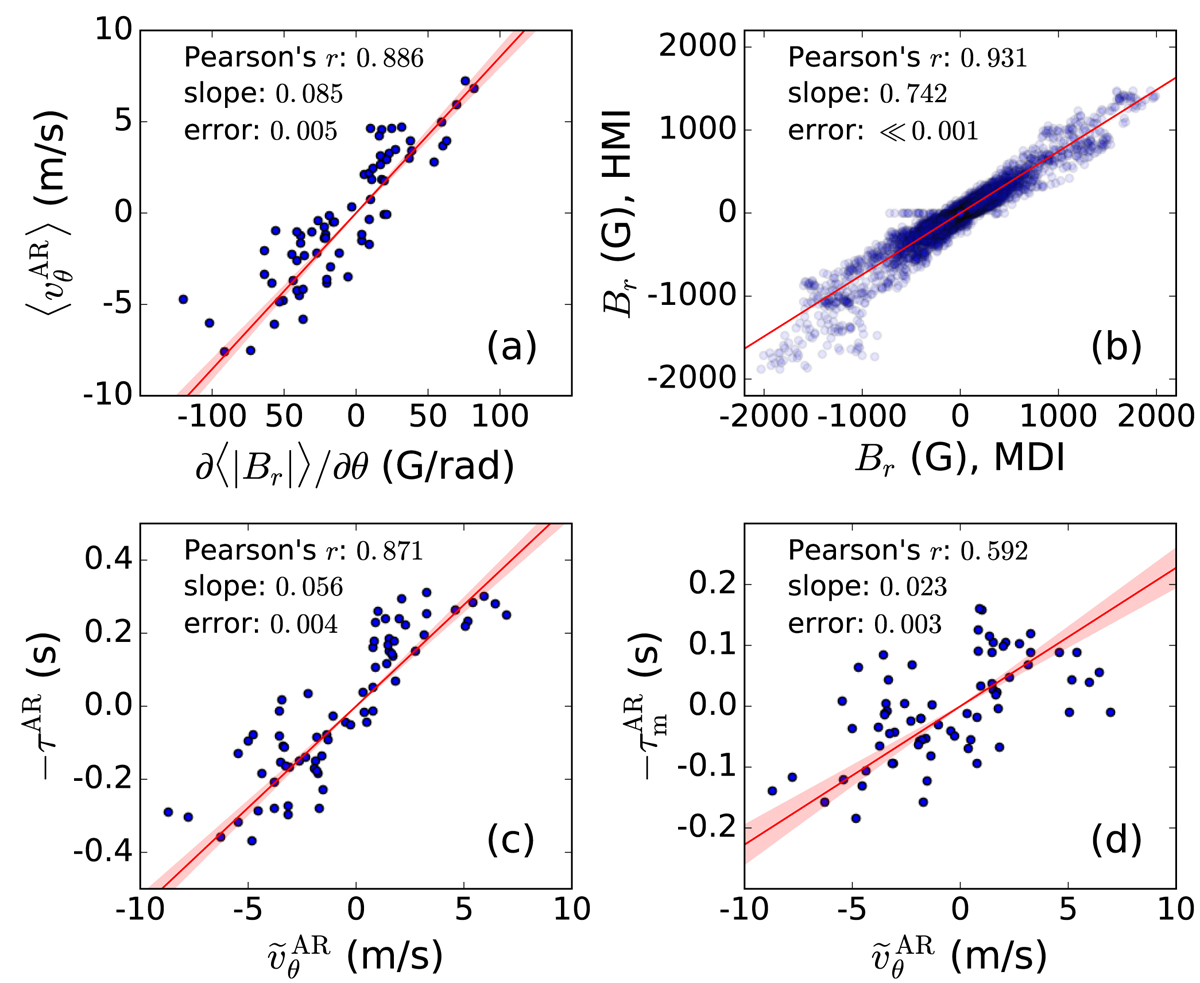
Scatter plots of the data used for the determination of the proportionality constant c0 (panel a), of the scaling factor for the magnetograms (panel b), of the conversion constant for ![]() (panel c), and the conversion constant for
(panel c), and the conversion constant for ![]() (panel d). The red lines indicate the best fits. The red shaded areas represent the errors on the slopes, obtained from the fits. The numbers in the top left corners are the values of the Pearson correlation coefficient, of the slope, and of the error on the slope. In all cases, the p values of the correlation coefficients are too small to be given here (≪0.01).
(panel d). The red lines indicate the best fits. The red shaded areas represent the errors on the slopes, obtained from the fits. The numbers in the top left corners are the values of the Pearson correlation coefficient, of the slope, and of the error on the slope. In all cases, the p values of the correlation coefficients are too small to be given here (≪0.01).
Current usage metrics show cumulative count of Article Views (full-text article views including HTML views, PDF and ePub downloads, according to the available data) and Abstracts Views on Vision4Press platform.
Data correspond to usage on the plateform after 2015. The current usage metrics is available 48-96 hours after online publication and is updated daily on week days.
Initial download of the metrics may take a while.