Fig. 1.
Download original image
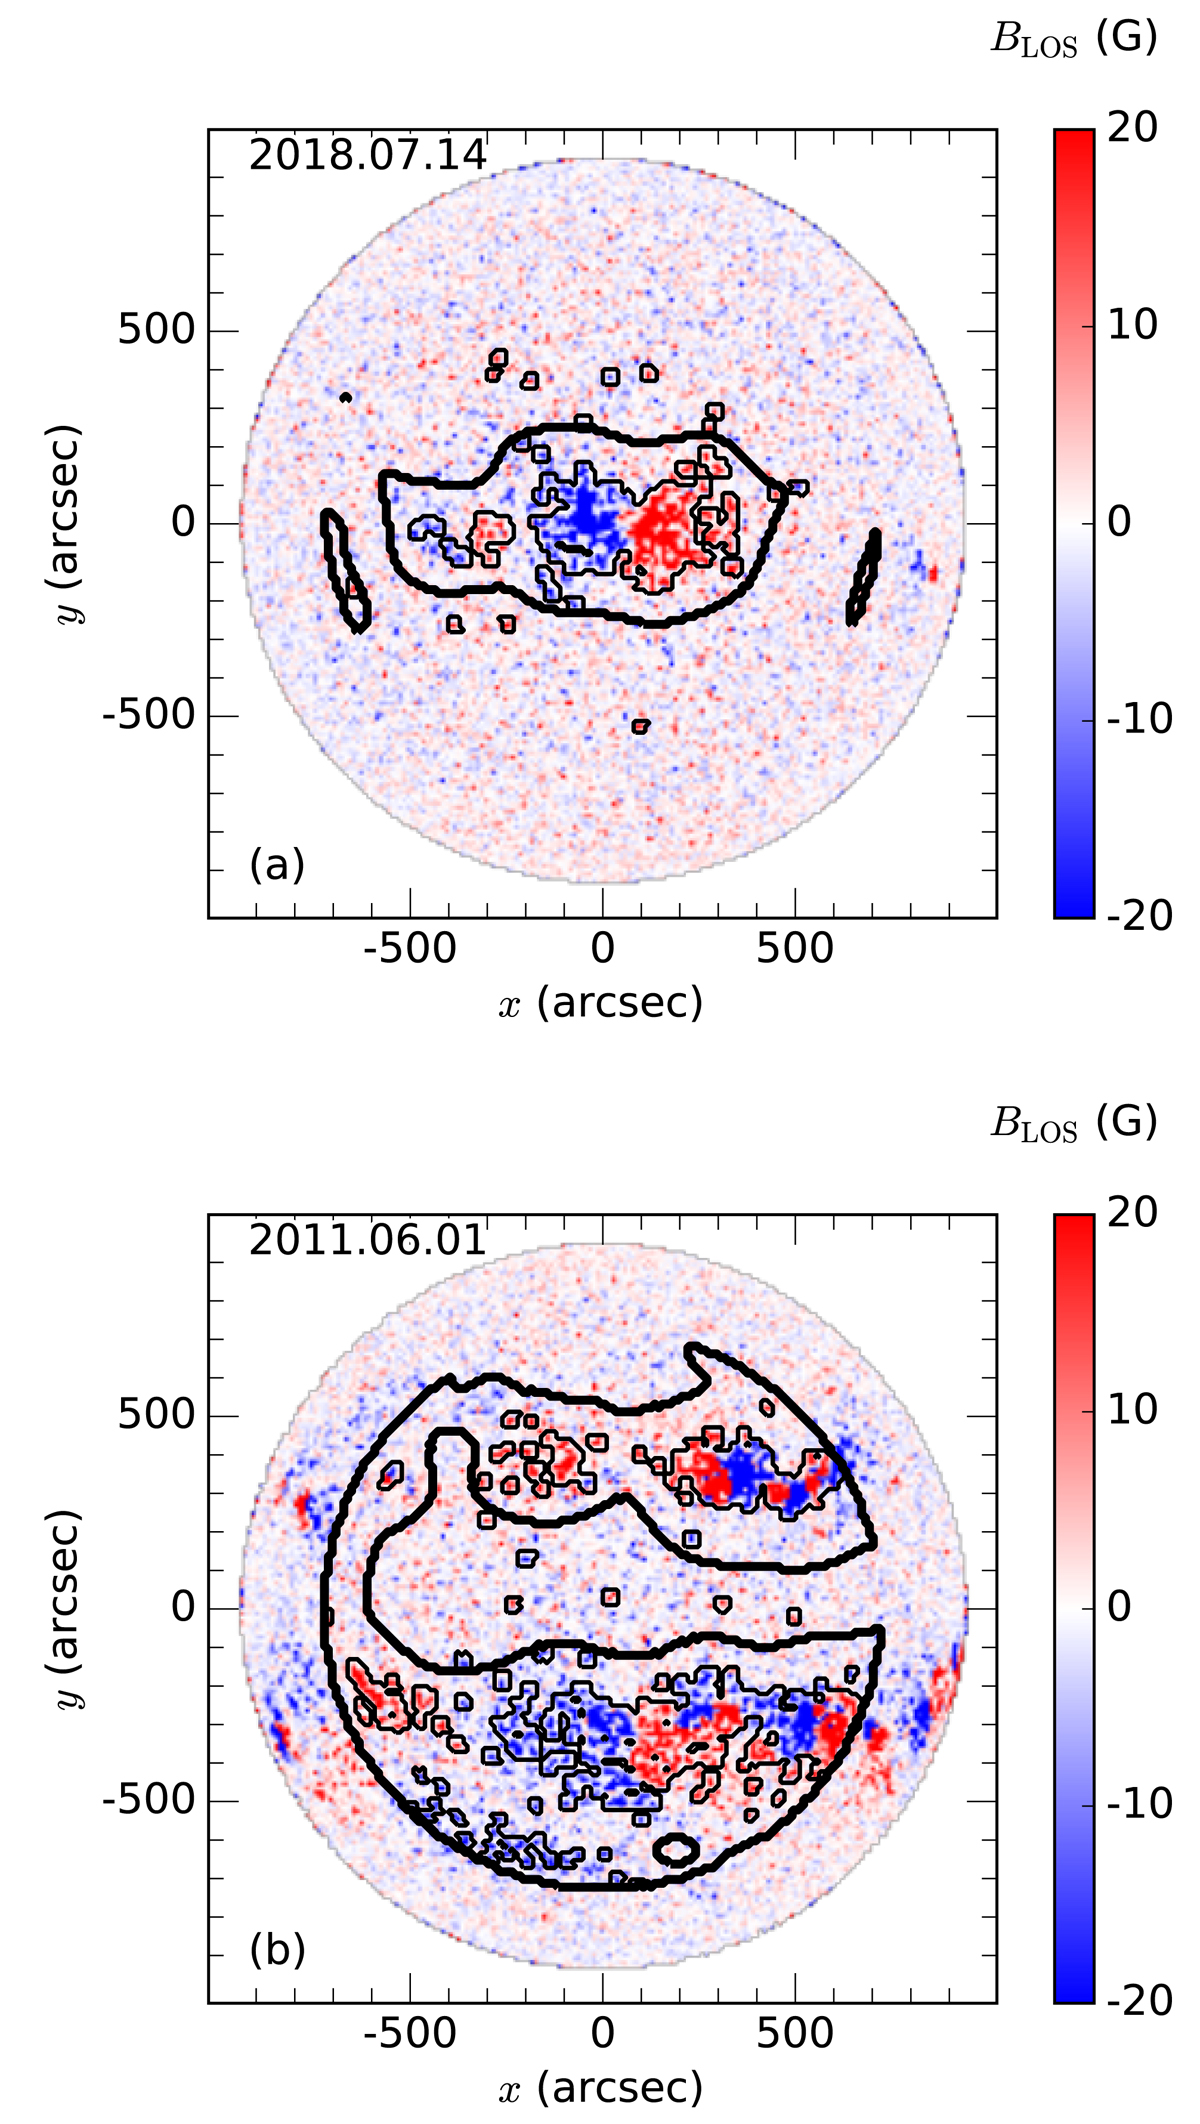
Contours around active-region flows (thick black lines) during solar minimum (panel a) and during the rising phase (panel b), superimposed on SDO/HMI magnetograms (line-of-sight magnetic field). The thin black lines represent the contours of the magnetic mask discussed in Sect. 4.2. We only consider pixels whose great-circle distance from disk center is less than 50°, and hence the contours do not encompass the magnetic features near the limb.
Current usage metrics show cumulative count of Article Views (full-text article views including HTML views, PDF and ePub downloads, according to the available data) and Abstracts Views on Vision4Press platform.
Data correspond to usage on the plateform after 2015. The current usage metrics is available 48-96 hours after online publication and is updated daily on week days.
Initial download of the metrics may take a while.