Fig. 9

Download original image
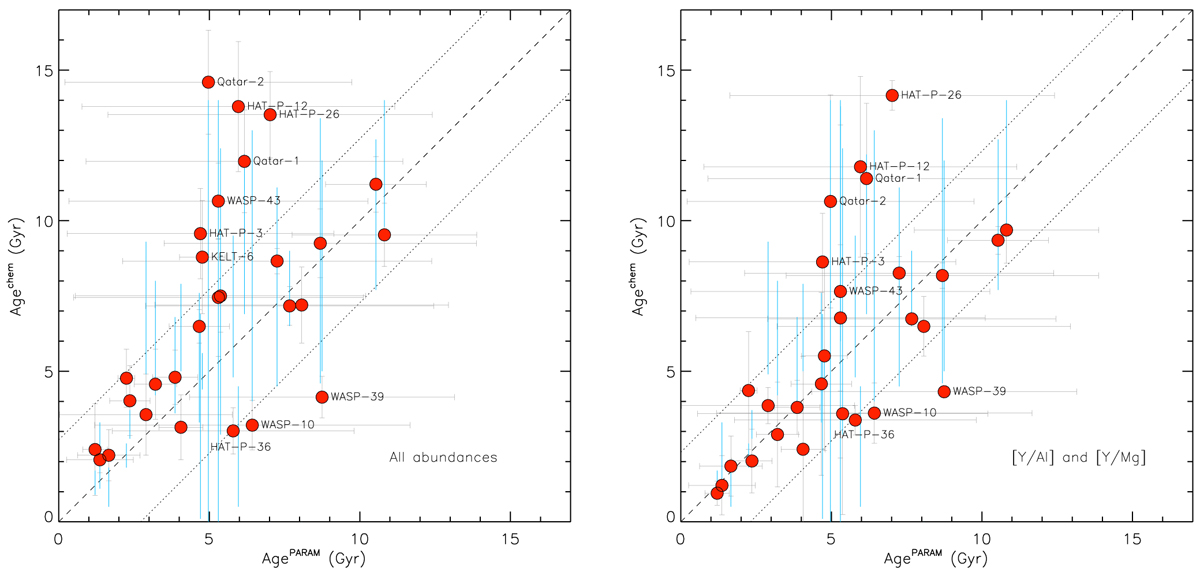
Comparison of the ages derived through abundance ratios and those inferred from the PARSEC models. We plot the results obtained considering all abundance ratios in common with Casali et al. (2020) (left panel) and the two best abundances ratios [Y/Al] and [Y/Mg] (right panel). Dashed line are the 1:1 relation, while the dotted lines represent the ± 1σ levels from the average. Stars outside the ± 1σ locus are marked. Light blue bars represent the range of values by Bonomo et al. (2017) obtained through Yonsei-Yale evolutionary tracks.
Current usage metrics show cumulative count of Article Views (full-text article views including HTML views, PDF and ePub downloads, according to the available data) and Abstracts Views on Vision4Press platform.
Data correspond to usage on the plateform after 2015. The current usage metrics is available 48-96 hours after online publication and is updated daily on week days.
Initial download of the metrics may take a while.


