Open Access
Fig. 7
Download original image
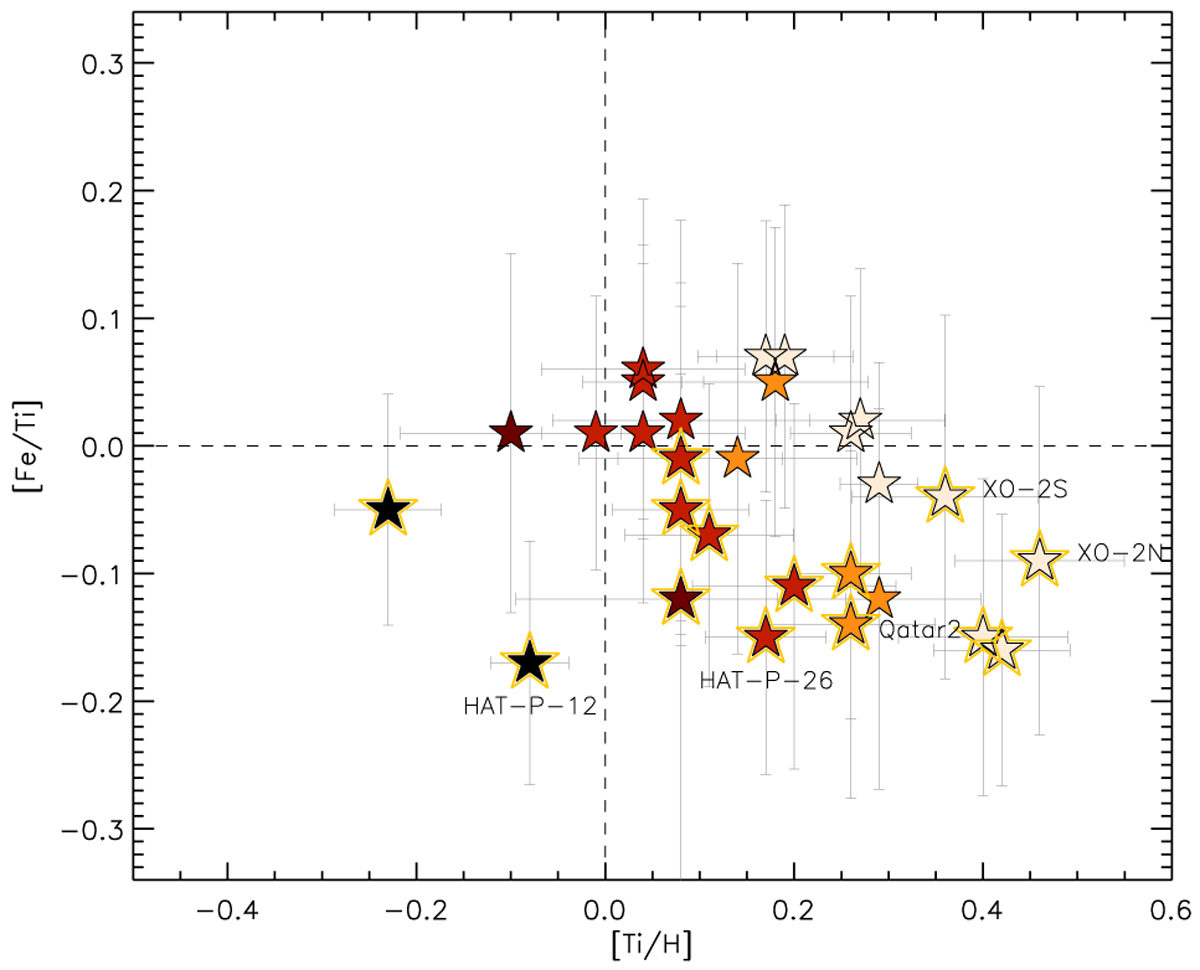
[Fe/Ti] vs. [Ti/H] abundance trends. The stars are color-coded according to their [Fe/H], as in Fig. 3. Empty yellow stars surround the targets with stellar ages greater than the median value of the sample (i.e., ~5.5 Gyr). Dashed lines represent the solar values. Stars with vtot > 70 km s−1 are labeled.
Current usage metrics show cumulative count of Article Views (full-text article views including HTML views, PDF and ePub downloads, according to the available data) and Abstracts Views on Vision4Press platform.
Data correspond to usage on the plateform after 2015. The current usage metrics is available 48-96 hours after online publication and is updated daily on week days.
Initial download of the metrics may take a while.