Fig. 5
Download original image
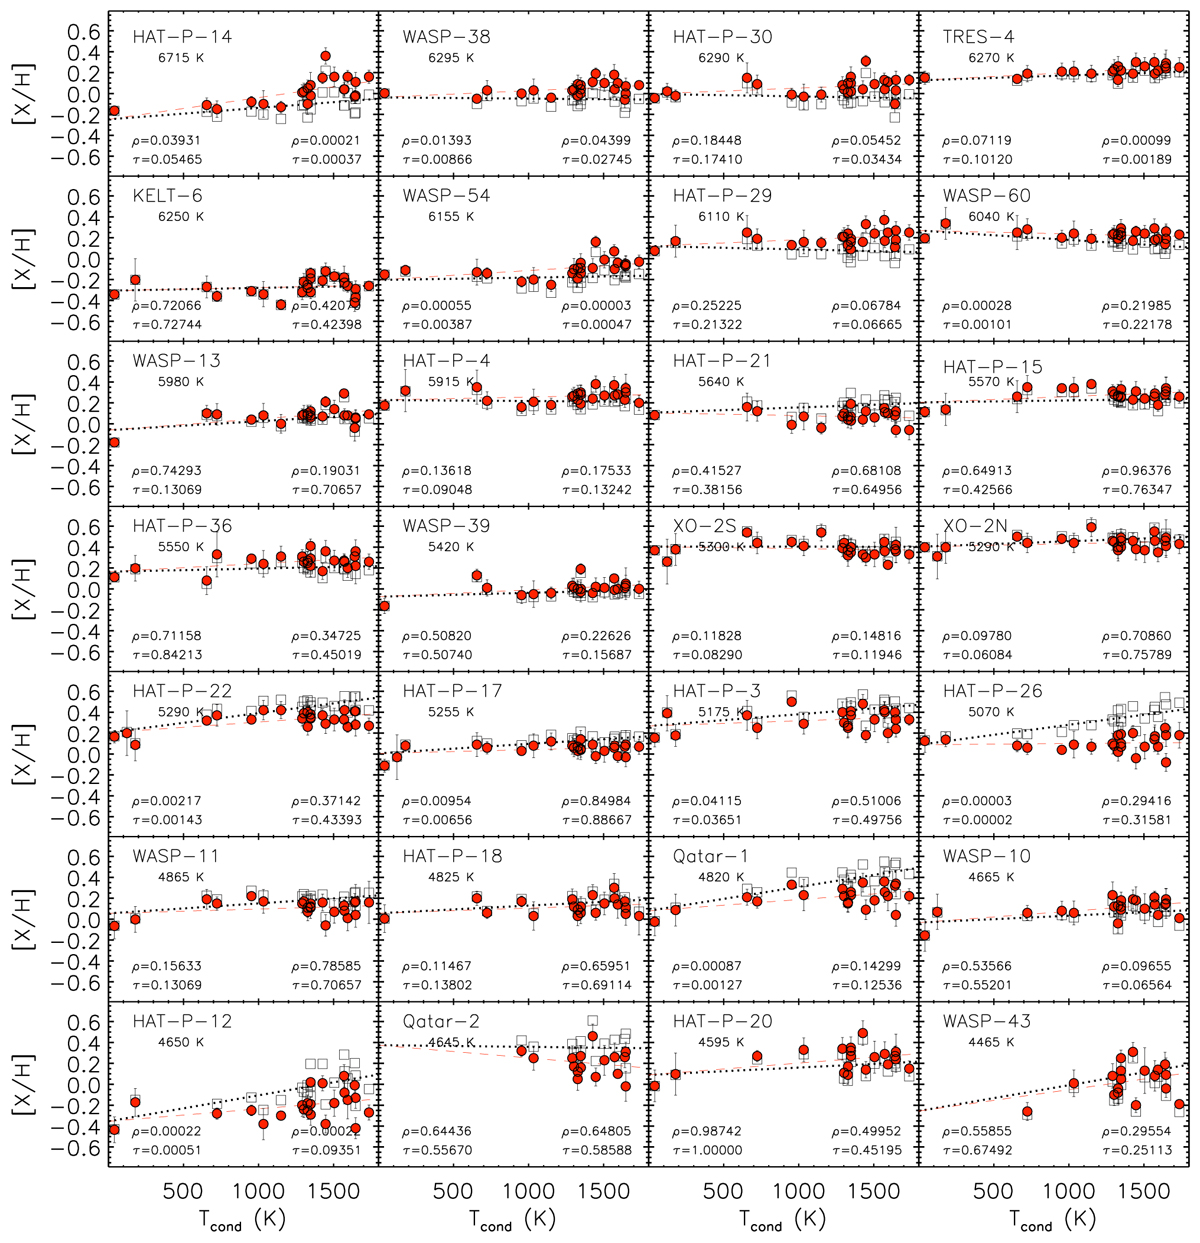
[X/H] vs. Tcond for all targets from the warmest HAT-P-14 to the coolest WASP-43. Open squares (together with black dotted line) and filled dots (together with red dashed line) correspond to the abundance values with and without the GCE correction. ρ and τ in all panels are the Spearman and Kendall significance after (left corner) and before (right corner) GCE removal.
Current usage metrics show cumulative count of Article Views (full-text article views including HTML views, PDF and ePub downloads, according to the available data) and Abstracts Views on Vision4Press platform.
Data correspond to usage on the plateform after 2015. The current usage metrics is available 48-96 hours after online publication and is updated daily on week days.
Initial download of the metrics may take a while.