Fig. 3
Download original image
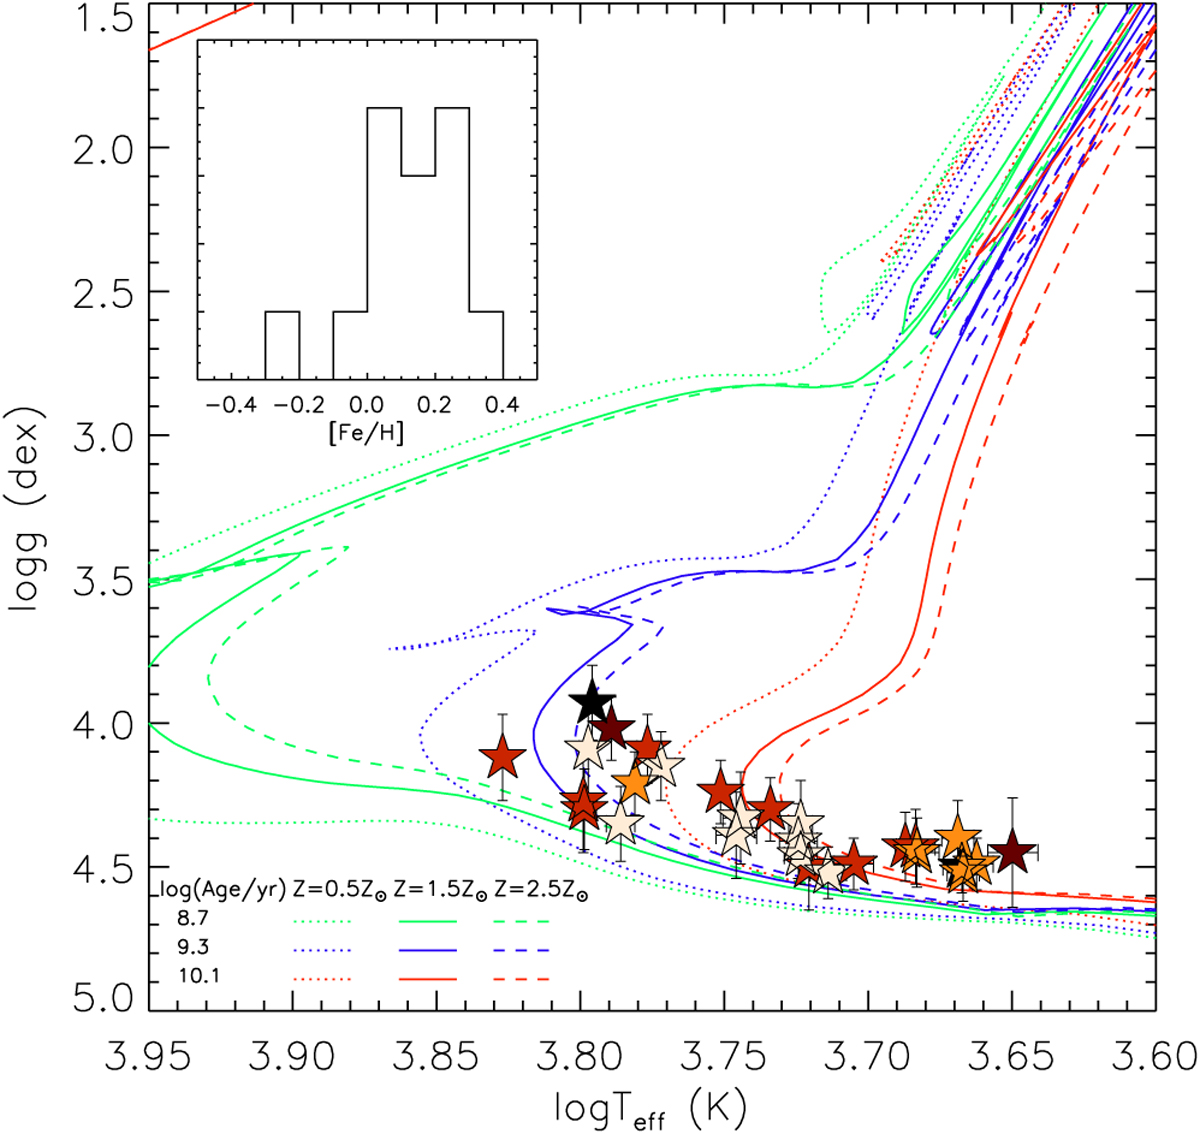
Teff-log g diagram for our stellar sample. The green, blue, and red lines are the PARSEC isochrones at ~500 Myr, ~2 Gyr, and ~12.5 Gyr. Dotted, solid, and dashed lines represent three different values of metallicities, as labeled in the bottom left corner. The inset represents the histogram distribution in [Fe/H] of our targets. The star symbols are colored from dark to light and represent the most metal-rich to most metal-poor stars according to four bins: [Fe/H] ≥ +0.24 dex, −0.12 < [Fe/H] ≤ +0.24 dex, −0.15 < [Fe/H] ≤ −0.02 dex, and [Fe/H] ≤ −0.15 dex.
Current usage metrics show cumulative count of Article Views (full-text article views including HTML views, PDF and ePub downloads, according to the available data) and Abstracts Views on Vision4Press platform.
Data correspond to usage on the plateform after 2015. The current usage metrics is available 48-96 hours after online publication and is updated daily on week days.
Initial download of the metrics may take a while.