Fig. B.1
Download original image
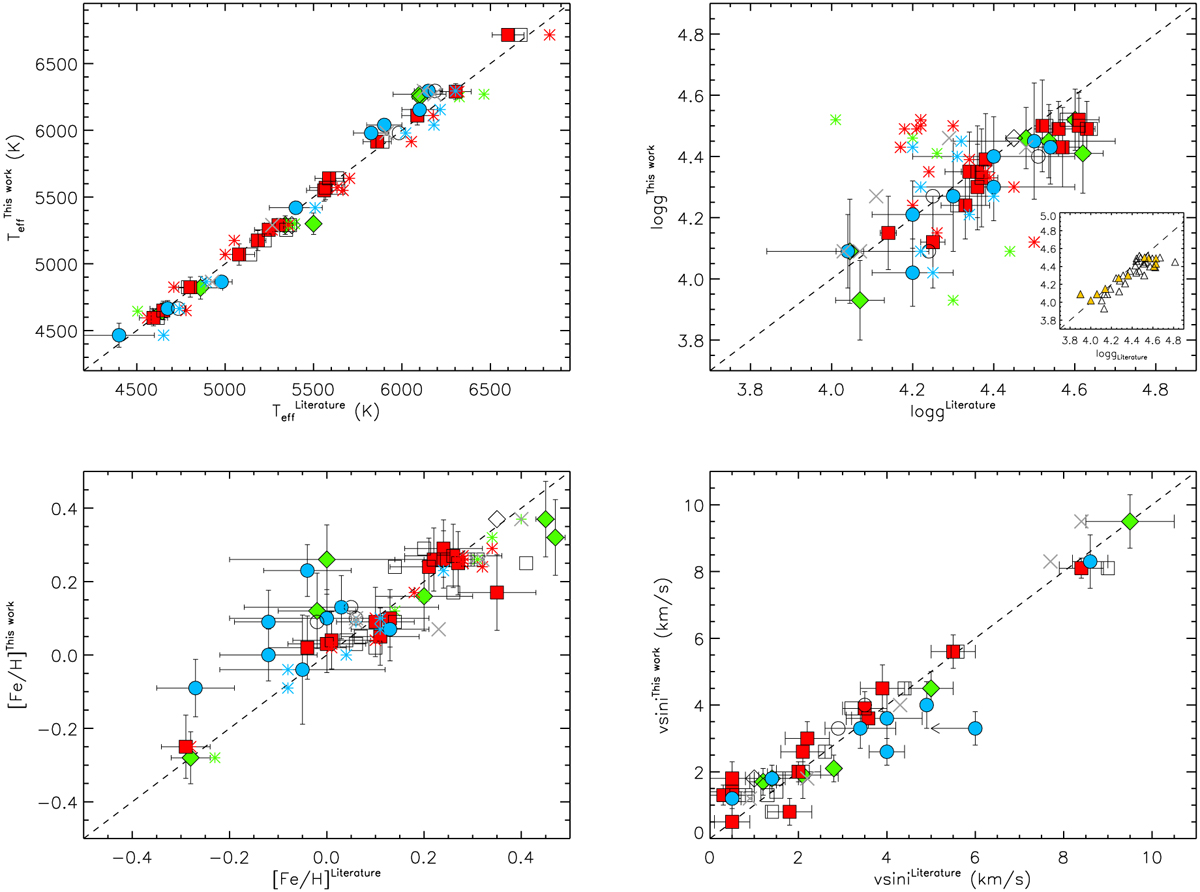
Comparison between our stellar parameters (Teff, log g, [Fe/H], v sin i) and those from the literature. Filled and open symbols represent the comparisons with the discovery papers and Torres et al. (2012), respectively (squares indicate the HAT-P sample, circles the WASP sample, and diamonds the remaining sample). Asterisks represent the comparison with the SWEET-Cat; in the log g plot the inset shows the comparison with the measurements obtained with the light curves by Mortier et al. 2013 (filled yellow triangles) or through Gaia parallaxes by Sousa et al. 2021 (open triangles). The crosses indicate the values obtained by Brewer et al. (2016).
Current usage metrics show cumulative count of Article Views (full-text article views including HTML views, PDF and ePub downloads, according to the available data) and Abstracts Views on Vision4Press platform.
Data correspond to usage on the plateform after 2015. The current usage metrics is available 48-96 hours after online publication and is updated daily on week days.
Initial download of the metrics may take a while.