Fig. 15
Download original image
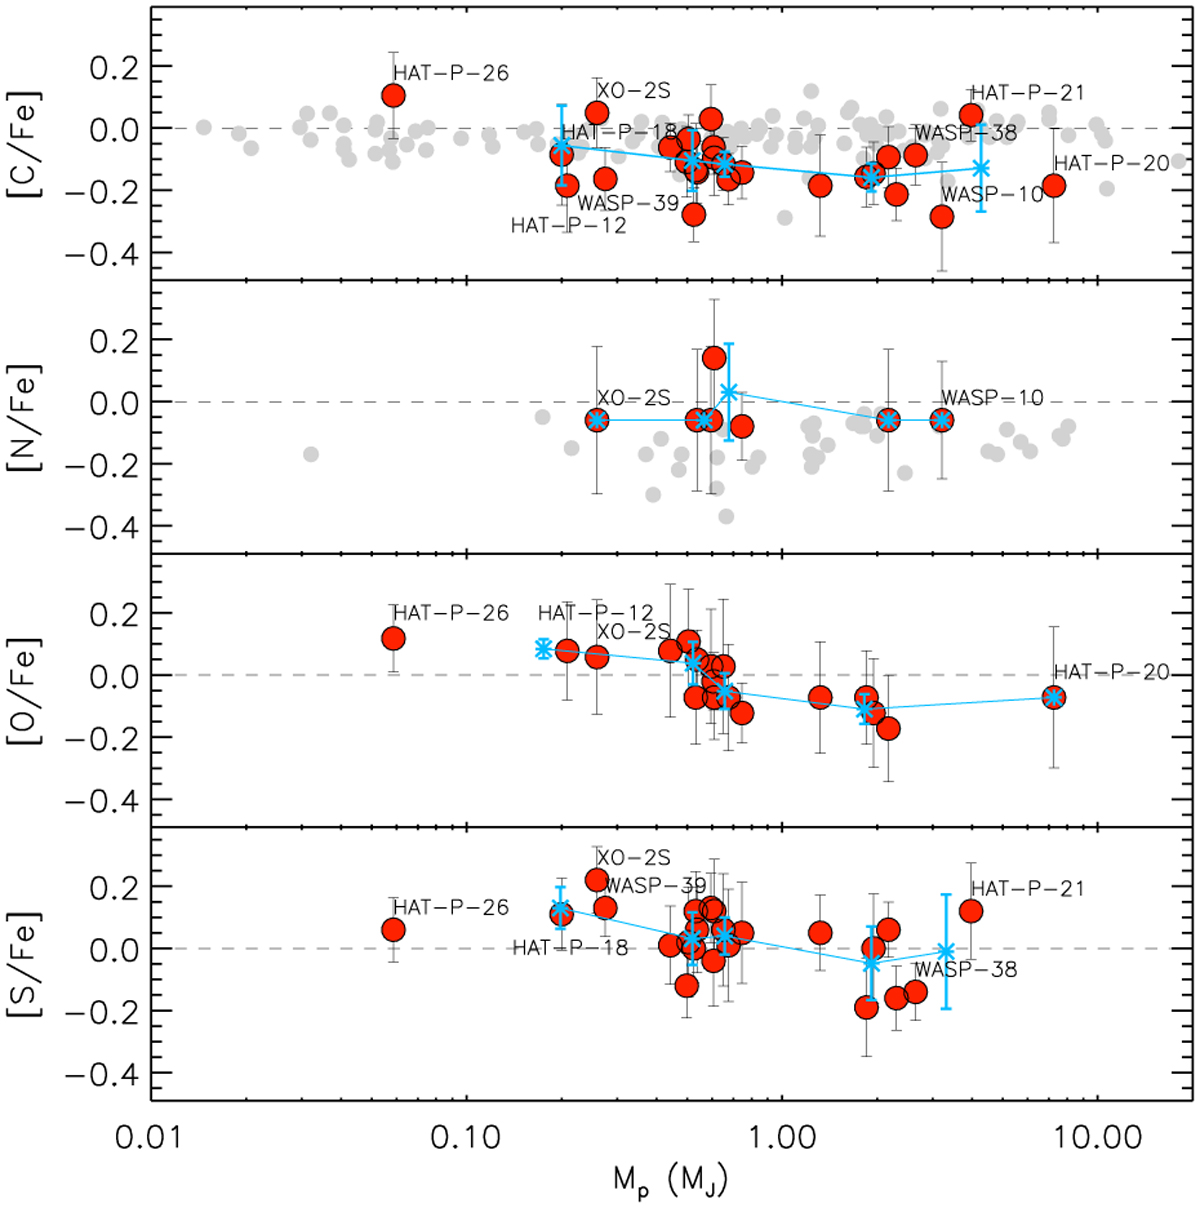
[C/Fe], [N/Fe], [O/Fe], and [S/Fe] vs. Mp. Asterisks represent binned values for Mp (< 0.4, 0.4–0.6, 0.6–1.2, 1.2–2.4, > 2.4 MJup) and the error bars show the standard deviation for each bin. The targets with Mp < 0.4 MJup and Mp > 2.4 MJup are labeled. The gray points for carbon and nitrogen are the values obtained for planet-hosting stars by Suárez-Andrés et al. (2016, 2017), respectively. The dashed lines represent the solar values.
Current usage metrics show cumulative count of Article Views (full-text article views including HTML views, PDF and ePub downloads, according to the available data) and Abstracts Views on Vision4Press platform.
Data correspond to usage on the plateform after 2015. The current usage metrics is available 48-96 hours after online publication and is updated daily on week days.
Initial download of the metrics may take a while.