Fig. 10
Download original image
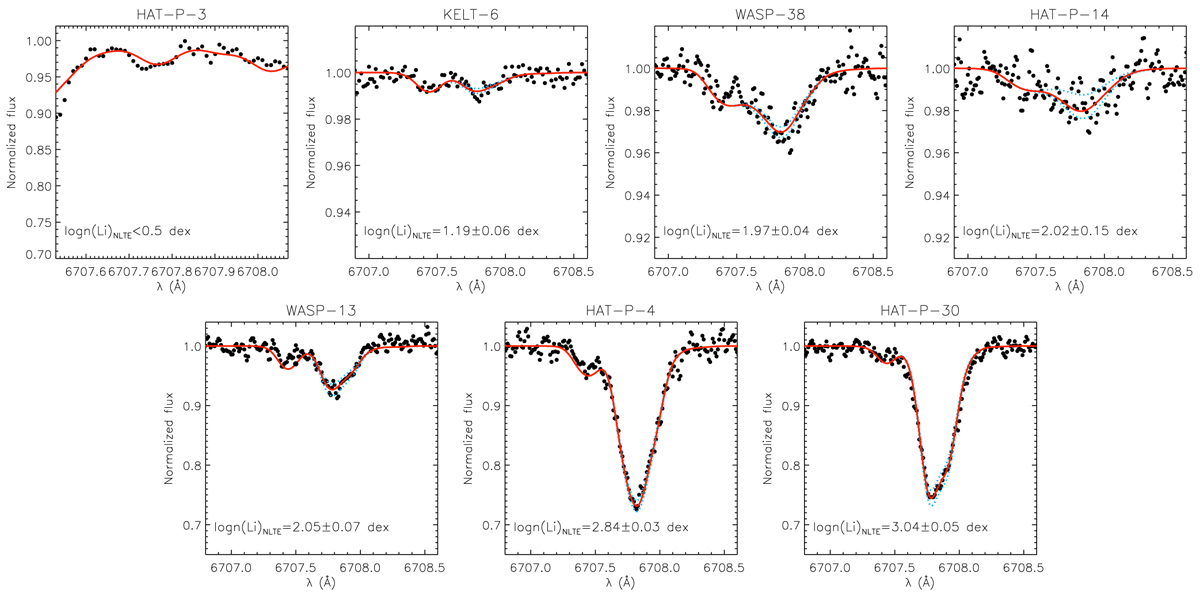
Spectral synthesis around the Li region for the seven stars with detected lithium (with the exception of HAT-P-3 for which only an upper limit in Li abundance was derived). The best-fit NLTE log n(Li) and its margins of error superimposed on the observed spectrum are shown with solid red and dotted light blue lines, respectively.
Current usage metrics show cumulative count of Article Views (full-text article views including HTML views, PDF and ePub downloads, according to the available data) and Abstracts Views on Vision4Press platform.
Data correspond to usage on the plateform after 2015. The current usage metrics is available 48-96 hours after online publication and is updated daily on week days.
Initial download of the metrics may take a while.